Fig. 16
Download original image
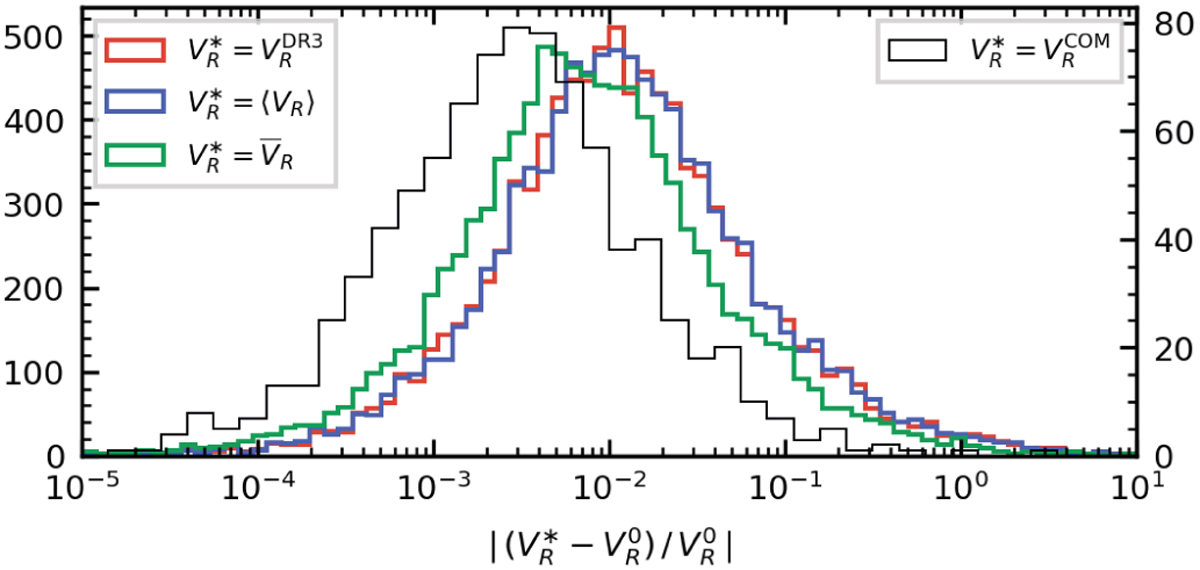
Comparison of several average RV indicators with the zero point of the RV time series models. Different indicators are displayed in different colors (red: median value ![]() published in Gaia DR3; blue: median value 〈VR〉 computed by variability processing; green: mean value
published in Gaia DR3; blue: median value 〈VR〉 computed by variability processing; green: mean value ![]() computed by variability processing). The histograms show the distribution of absolute difference between each of the average values and
computed by variability processing). The histograms show the distribution of absolute difference between each of the average values and ![]() , normalized to the latter. The thin black histogram, limited to a subset of the FPR sample, compares
, normalized to the latter. The thin black histogram, limited to a subset of the FPR sample, compares ![]() with the center-of-mass velocity
with the center-of-mass velocity ![]() derived by the non-single stars processing pipeline for Gaia DR3 (see Sect. 4.1.2 for more details), and refers to the scale on the right-hand side axis.
derived by the non-single stars processing pipeline for Gaia DR3 (see Sect. 4.1.2 for more details), and refers to the scale on the right-hand side axis.
Current usage metrics show cumulative count of Article Views (full-text article views including HTML views, PDF and ePub downloads, according to the available data) and Abstracts Views on Vision4Press platform.
Data correspond to usage on the plateform after 2015. The current usage metrics is available 48-96 hours after online publication and is updated daily on week days.
Initial download of the metrics may take a while.