Fig. 15
Download original image
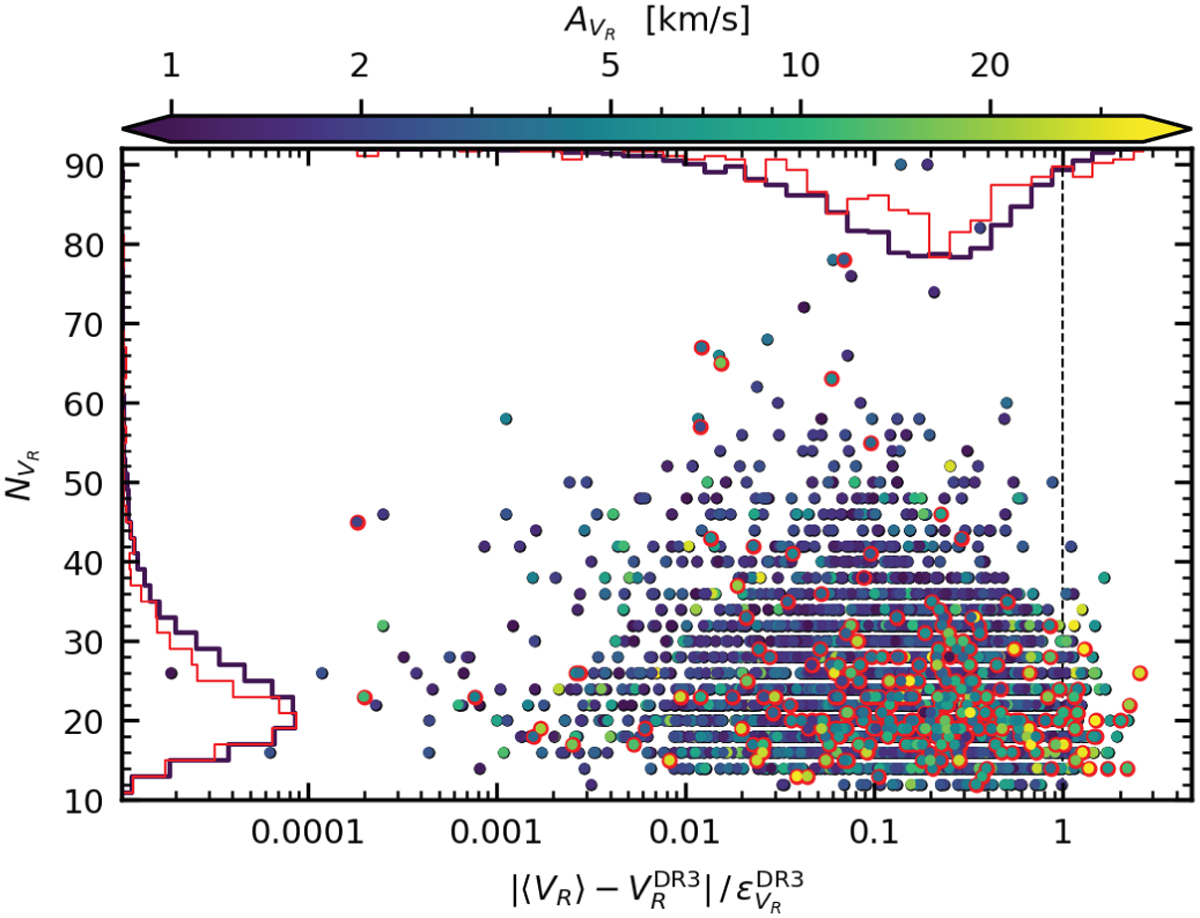
Number ![]() of epochs retained for RV variability processing against the absolute difference between the median RV derived by variability processing (〈VR〉) and published in Gaia DR3 (
of epochs retained for RV variability processing against the absolute difference between the median RV derived by variability processing (〈VR〉) and published in Gaia DR3 (![]() ), scaled to the RV uncertainty
), scaled to the RV uncertainty ![]() published in DR3. Data points are color-coded by the semi-amplitude of the RV time series model. The time series that had one RV epoch excluded by outlier removal during variability processing are circled in red. The value 〈VR〉 for these sources is computed from one fewer epoch compared to
published in DR3. Data points are color-coded by the semi-amplitude of the RV time series model. The time series that had one RV epoch excluded by outlier removal during variability processing are circled in red. The value 〈VR〉 for these sources is computed from one fewer epoch compared to ![]() .
.
Current usage metrics show cumulative count of Article Views (full-text article views including HTML views, PDF and ePub downloads, according to the available data) and Abstracts Views on Vision4Press platform.
Data correspond to usage on the plateform after 2015. The current usage metrics is available 48-96 hours after online publication and is updated daily on week days.
Initial download of the metrics may take a while.