Fig. 10
Download original image
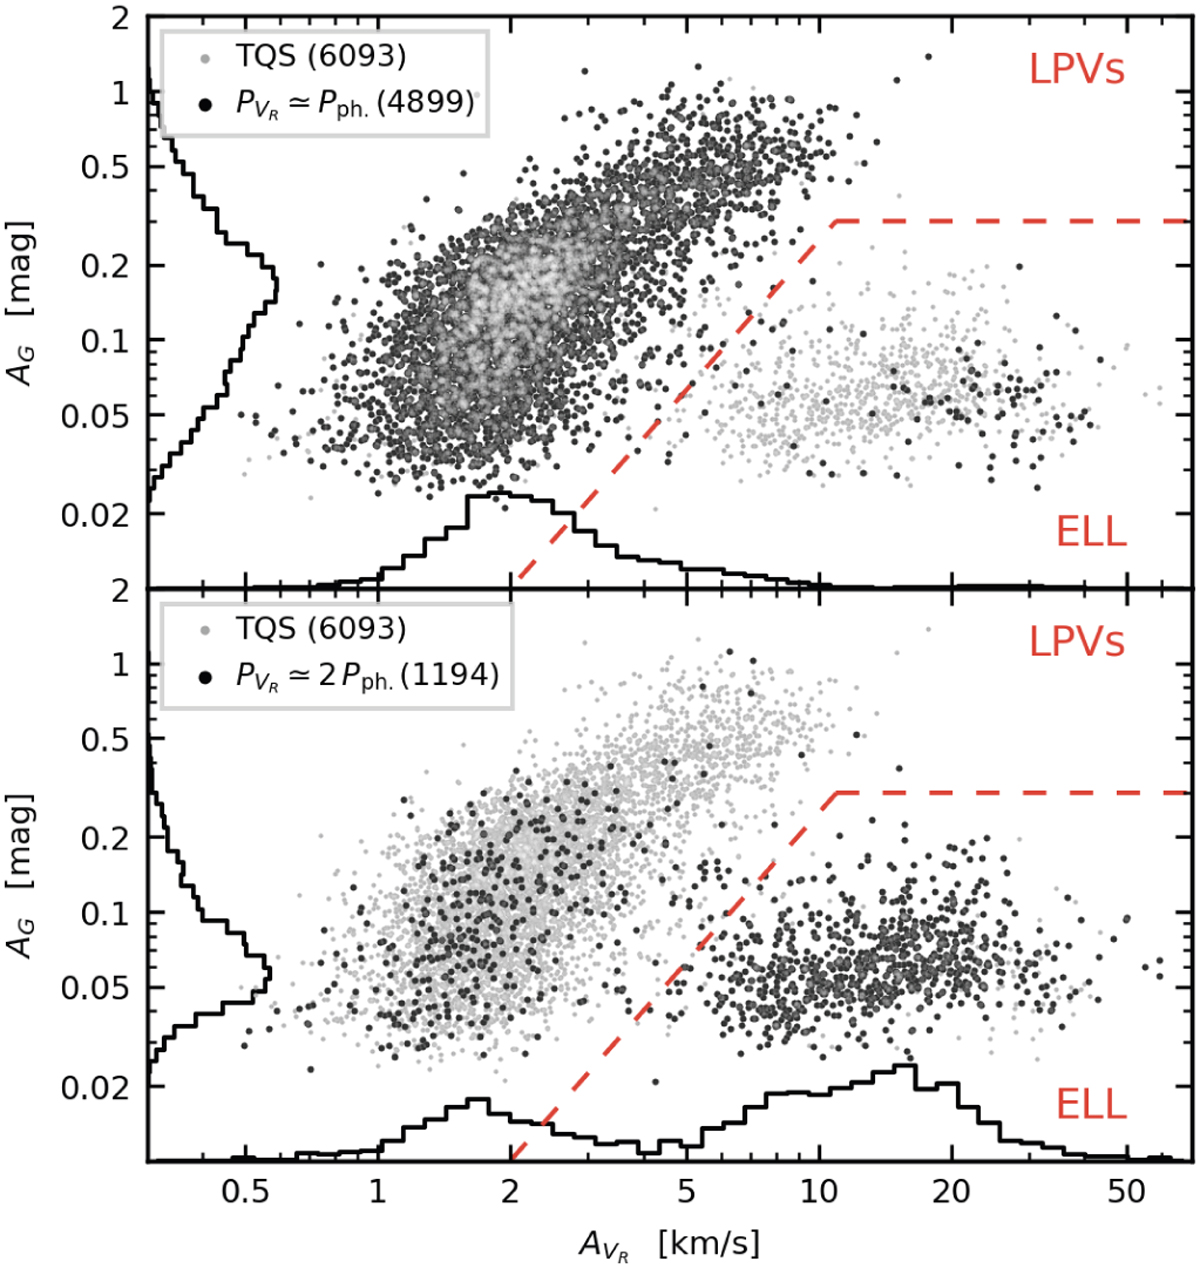
Comparison between the semi-amplitudes AG, ![]() of the best-fit models of the G-band and RV time series for the TQS (light gray symbols in the background). The darker symbols indicate sources whose RV period is consistent with the photometric periods in a 1:1 ratio (top panel) or in a 2:1 ratio (bottom panel). The dashed red line corresponds to Eq. (9), and the size of each sample is indicated in the legend.
of the best-fit models of the G-band and RV time series for the TQS (light gray symbols in the background). The darker symbols indicate sources whose RV period is consistent with the photometric periods in a 1:1 ratio (top panel) or in a 2:1 ratio (bottom panel). The dashed red line corresponds to Eq. (9), and the size of each sample is indicated in the legend.
Current usage metrics show cumulative count of Article Views (full-text article views including HTML views, PDF and ePub downloads, according to the available data) and Abstracts Views on Vision4Press platform.
Data correspond to usage on the plateform after 2015. The current usage metrics is available 48-96 hours after online publication and is updated daily on week days.
Initial download of the metrics may take a while.