Fig. 1
Download original image
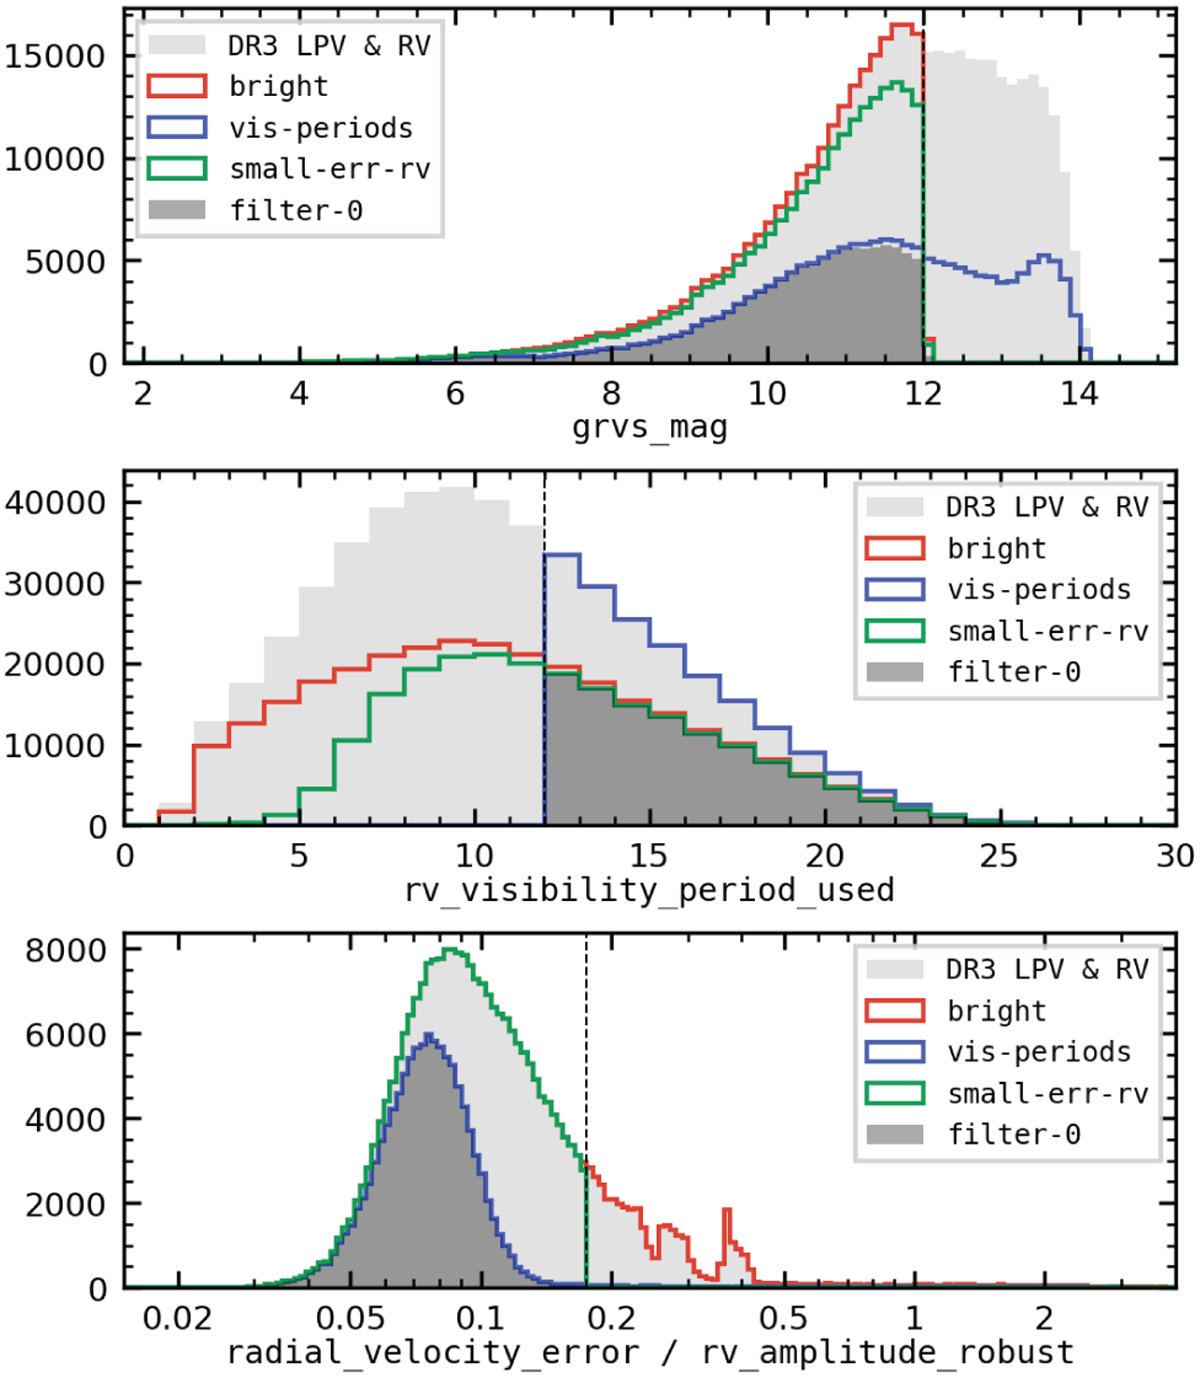
Distribution of the pre-filtering parameters GRVS (top panel), rv_visibility_periods_used (middle panel), and ![]() /rv_amplitude_robust (bottom panel), with vertical dashed lines indicating the filter limits. Different colors indicate the starting set (DR3-LPV-RV, gray filled histogram) and the individual pre-filters, labeled bright (red curve), vis-periods (blue curve), and small-err-rv (green curve) as in Table 1. The black filled histogram corresponds to the application of all three pre-filters (filter-0). We note that 50 349 sources in the starting sample of 501 308 sources lack a published value of GRVS as it would be fainter than 14.1 mag, and that the quantity rv_amplitude_robust is not provided for sources with GRVS > 12 mag (Sartoretti et al. 2023).
/rv_amplitude_robust (bottom panel), with vertical dashed lines indicating the filter limits. Different colors indicate the starting set (DR3-LPV-RV, gray filled histogram) and the individual pre-filters, labeled bright (red curve), vis-periods (blue curve), and small-err-rv (green curve) as in Table 1. The black filled histogram corresponds to the application of all three pre-filters (filter-0). We note that 50 349 sources in the starting sample of 501 308 sources lack a published value of GRVS as it would be fainter than 14.1 mag, and that the quantity rv_amplitude_robust is not provided for sources with GRVS > 12 mag (Sartoretti et al. 2023).
Current usage metrics show cumulative count of Article Views (full-text article views including HTML views, PDF and ePub downloads, according to the available data) and Abstracts Views on Vision4Press platform.
Data correspond to usage on the plateform after 2015. The current usage metrics is available 48-96 hours after online publication and is updated daily on week days.
Initial download of the metrics may take a while.