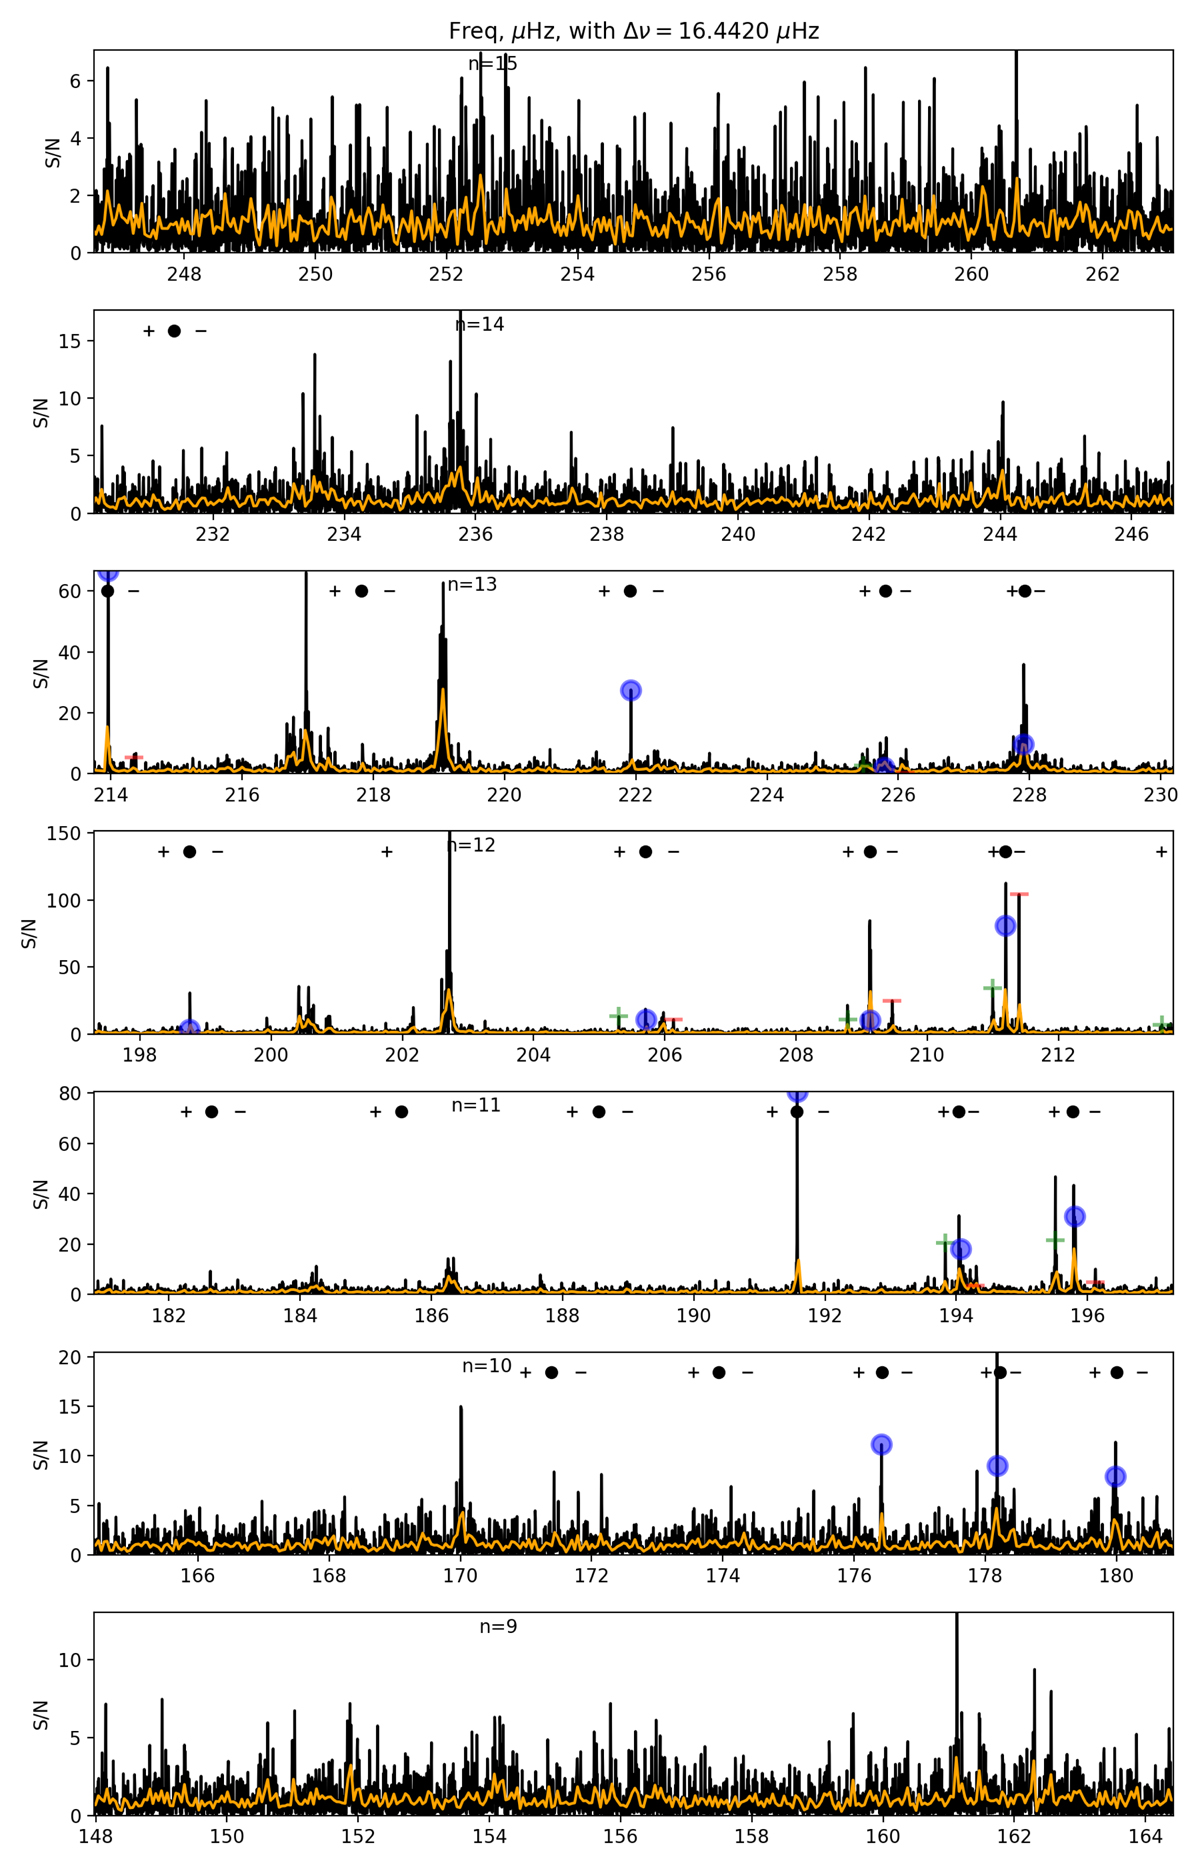
Fig. B.1.
Download original image
Normal échelle diagram of KIC 4458118. The frequencies are folded by the large separation Δν = 16.4420 μHz. The modes which are used in the fitting procedure are marked by the colour symbols: green ‘+’ for m = 1, purple ‘•’ for m = 0, and red ‘-’ for m=-1 modes. The best-fitting frequencies are marked by the black ‘+’, ‘•’, ‘-’ symbols at the top of each panel.
Current usage metrics show cumulative count of Article Views (full-text article views including HTML views, PDF and ePub downloads, according to the available data) and Abstracts Views on Vision4Press platform.
Data correspond to usage on the plateform after 2015. The current usage metrics is available 48-96 hours after online publication and is updated daily on week days.
Initial download of the metrics may take a while.