Fig. 1.
Download original image
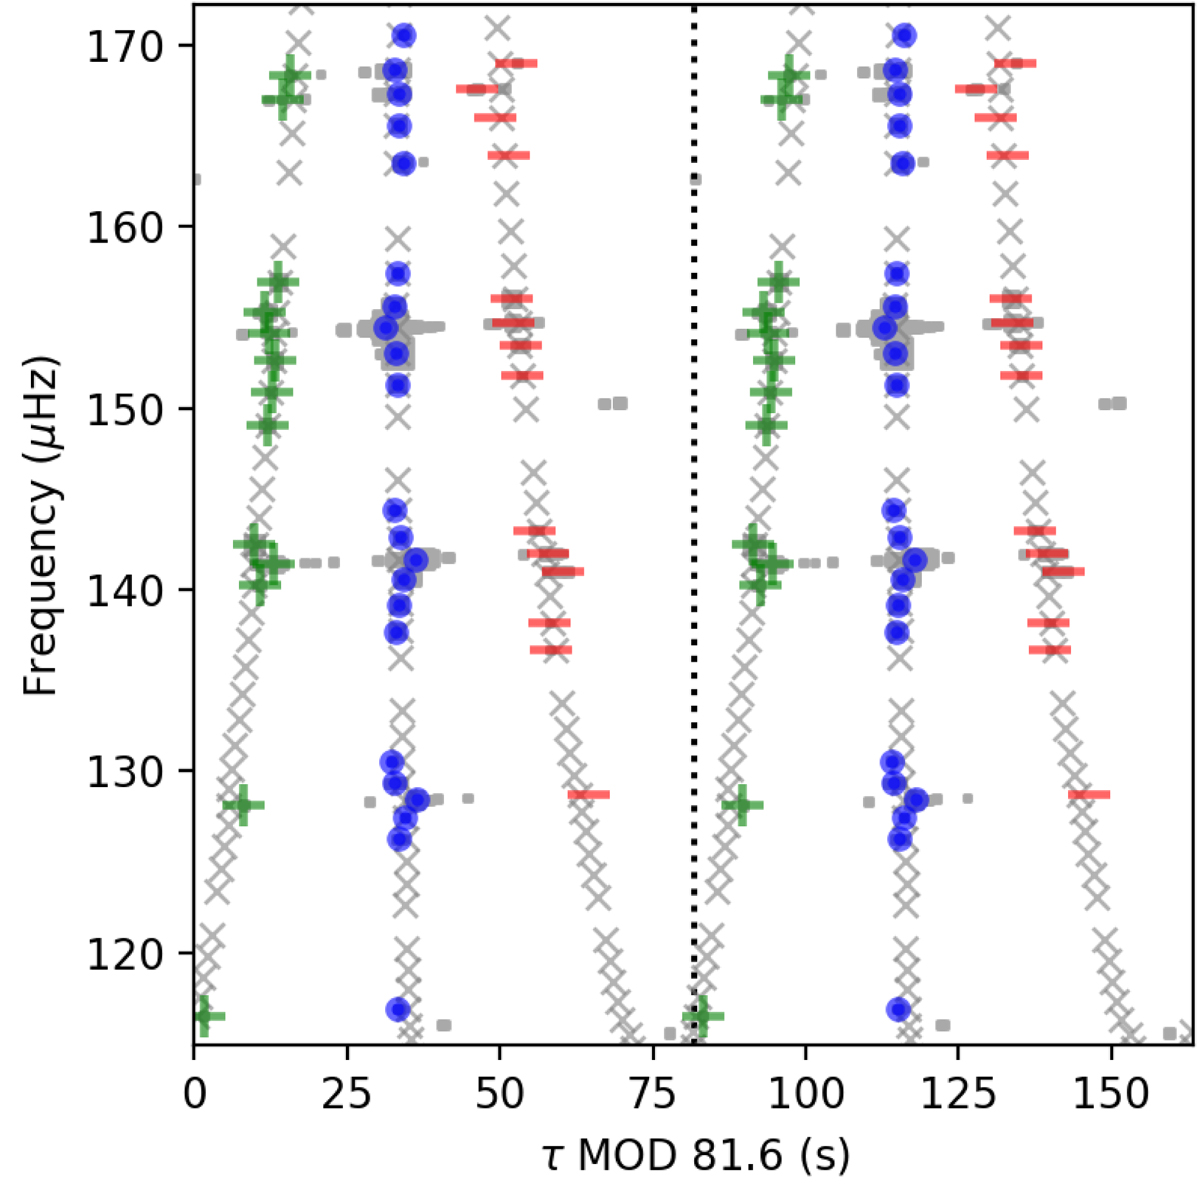
Stretched échelle diagram of KIC 5792889 that does not show any magnetism-induced perturbation. The x-axis is the stretched periods τ modulo ΔΠ1 ≈ 81.6 s. The peaks with S/N > 10 are shown by the grey points (l = 0 and l = 2 modes have been removed). The green ‘+’ stands for the m = 1 modes. The red ‘−’ stands for the m = −1 modes. The blue ‘•’ shows the m = 0 modes. The best-fitting results are plotted by the cross.
Current usage metrics show cumulative count of Article Views (full-text article views including HTML views, PDF and ePub downloads, according to the available data) and Abstracts Views on Vision4Press platform.
Data correspond to usage on the plateform after 2015. The current usage metrics is available 48-96 hours after online publication and is updated daily on week days.
Initial download of the metrics may take a while.