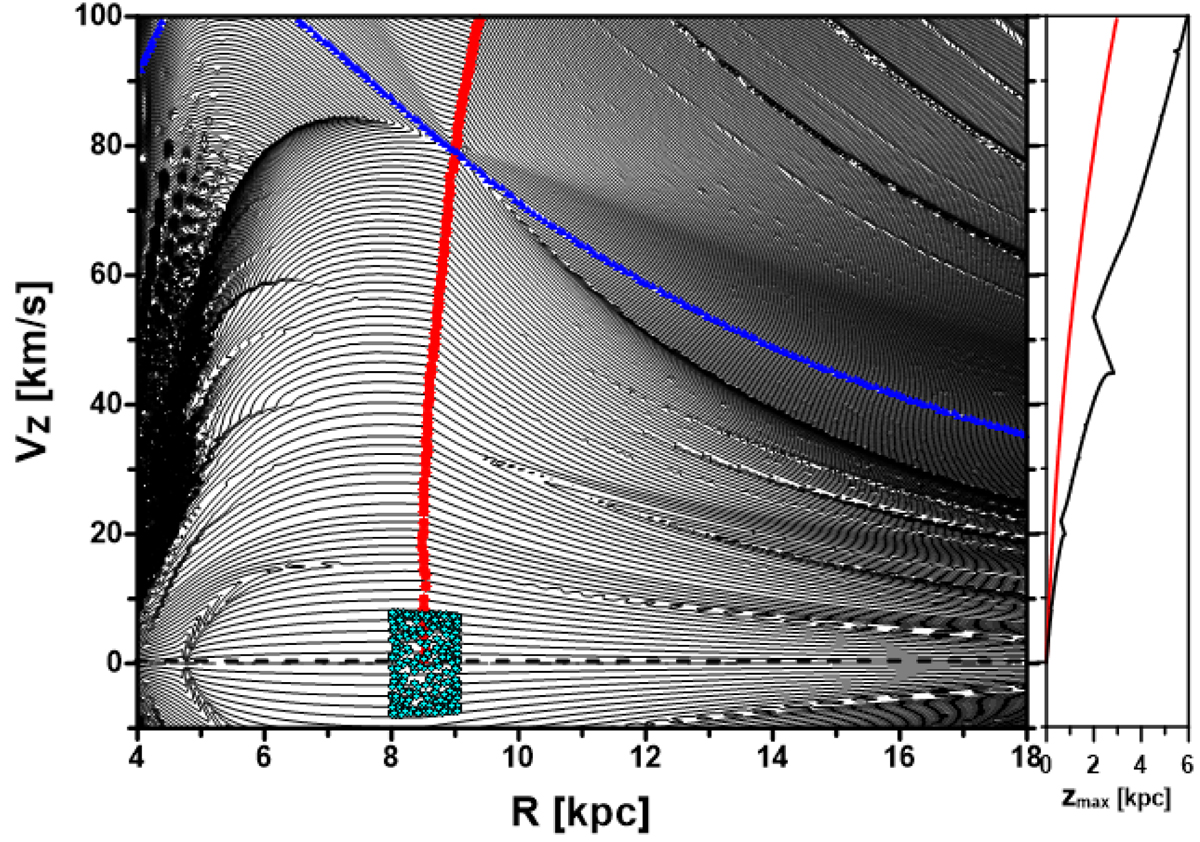
Fig. 8.
Download original image
R–Vz plane of initial conditions chosen along the Sun’s Lz-level, with pR = 0 and z = 0. The equidistant levels of the maximal vertical deviation from the equatorial plane, zmax, are shown by continuous curves; its value mainly increases with the increasing Vz (see beside panel to associate the absolute zmax-values). The red curve shows the location of the circular orbits with Lz = 1995 kpc km s−1 as a function of the initial Vz. The structures, which are characteristic of the e–z resonances, appear on both sides of the red curve, expanding their domains with increasing eccentricities. The blue curve shows loci of the very strong 1/1 resonance. The projection of the Sun’s orbit is shown by cyan dots; its maximal z-amplitude is around 0.85 kpc. Side panel: zmax-values as a function of the initial Vz, for circular orbits (red curve) and orbits with initial R = 13 kpc (black curve).
Current usage metrics show cumulative count of Article Views (full-text article views including HTML views, PDF and ePub downloads, according to the available data) and Abstracts Views on Vision4Press platform.
Data correspond to usage on the plateform after 2015. The current usage metrics is available 48-96 hours after online publication and is updated daily on week days.
Initial download of the metrics may take a while.