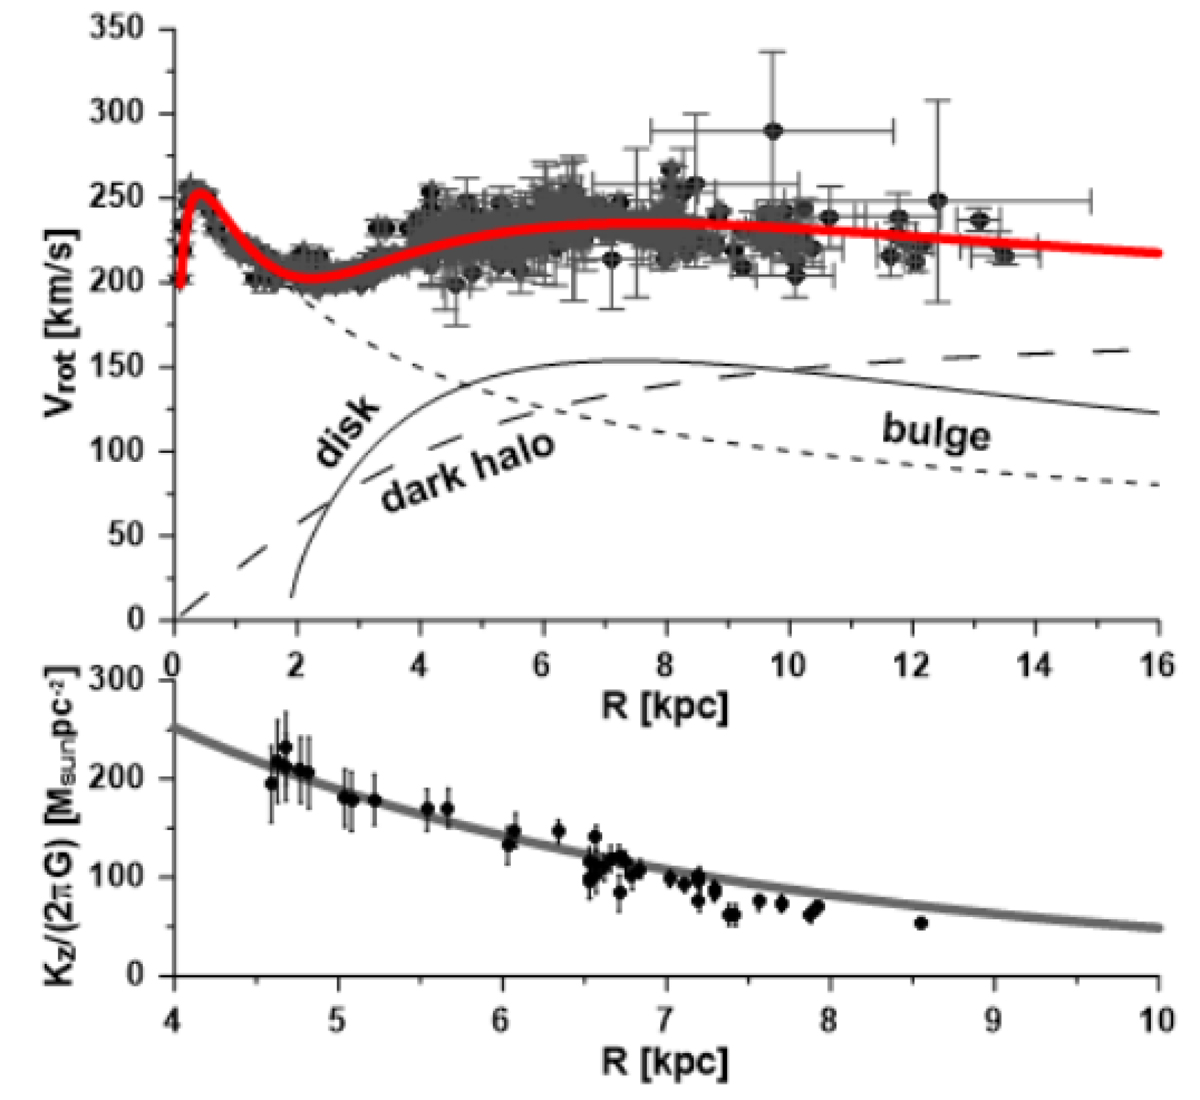
Fig. 1.
Download original image
Observed and modelled radial and vertical force field profiles as functions of Galactocentric distances. Top: rotation curve of the Galaxy. The observed rotation curve is represented by the points with error bars, which indicate masers data from high-mass star-forming regions (Reid et al. 2019; Rastorguev et al. 2017), and H I and CO tangent-point data (Burton & Gordon 1978; Clemens 1985; Fich et al. 1989). The red curve shows the analytical rotation curve expressed by Eq. (10). The contributions of the modelled disc (continuous curve), bulge (short-dashed line), and dark halo (long-dashed line) to the axisymmetric Galactic potential are also shown. Bottom: vertical force, Kz, at z = 1.1 kpc as a function of the Galactic radius. The black dots with error bars are from observation measurements by Bovy & Rix (2013), while the solid grey curve shows the Kz force radial profile at z = 1.1 kpc resulting from our Galactic model.
Current usage metrics show cumulative count of Article Views (full-text article views including HTML views, PDF and ePub downloads, according to the available data) and Abstracts Views on Vision4Press platform.
Data correspond to usage on the plateform after 2015. The current usage metrics is available 48-96 hours after online publication and is updated daily on week days.
Initial download of the metrics may take a while.