Open Access
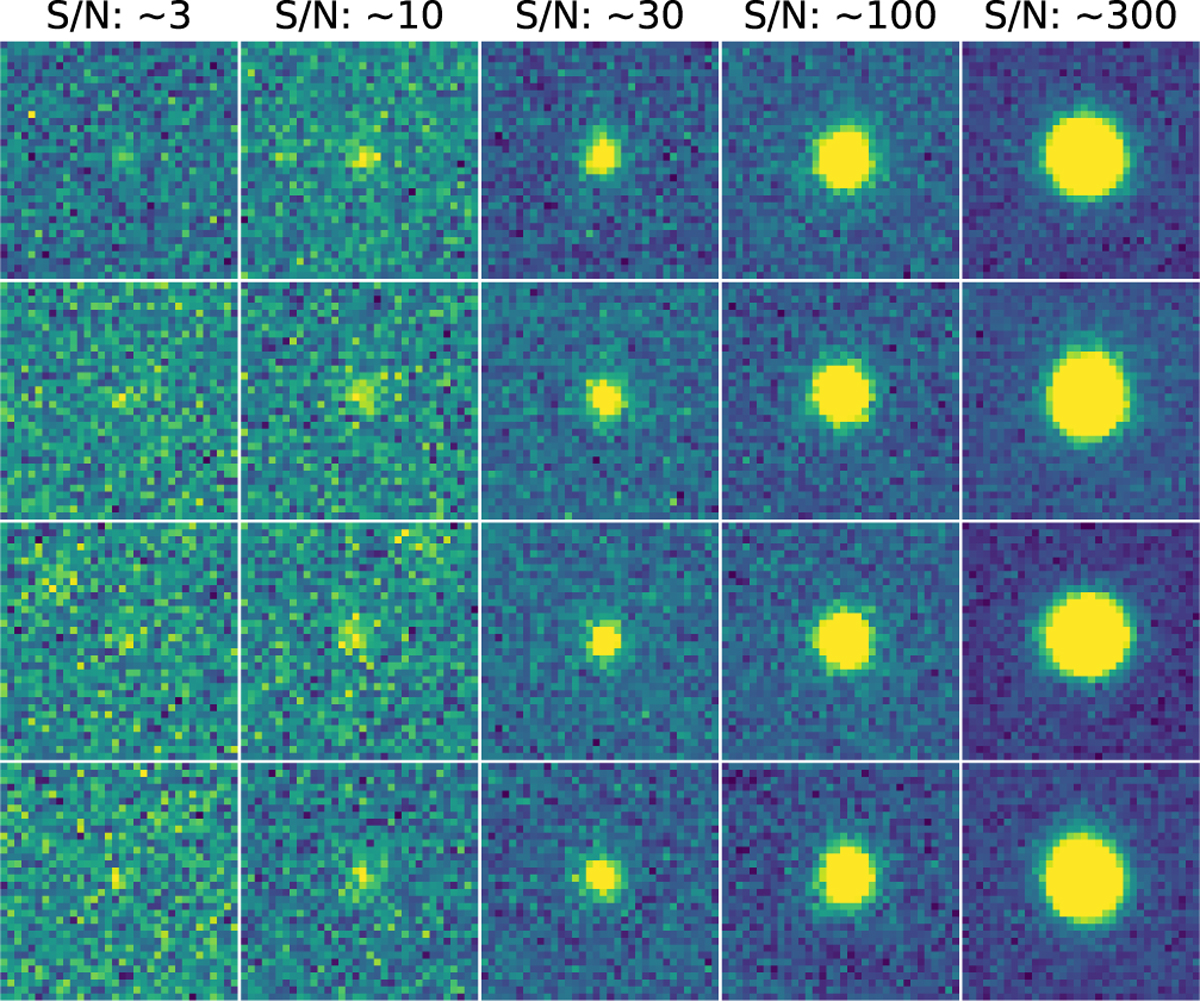
Fig. 2
Download original image
Random selection of cutouts from the synthetic exposures showcasing the variety and quality of the simulated data. This visual representation aids in understanding the conditions and challenges the network is designed to handle.
Current usage metrics show cumulative count of Article Views (full-text article views including HTML views, PDF and ePub downloads, according to the available data) and Abstracts Views on Vision4Press platform.
Data correspond to usage on the plateform after 2015. The current usage metrics is available 48-96 hours after online publication and is updated daily on week days.
Initial download of the metrics may take a while.