Fig. 10
Download original image
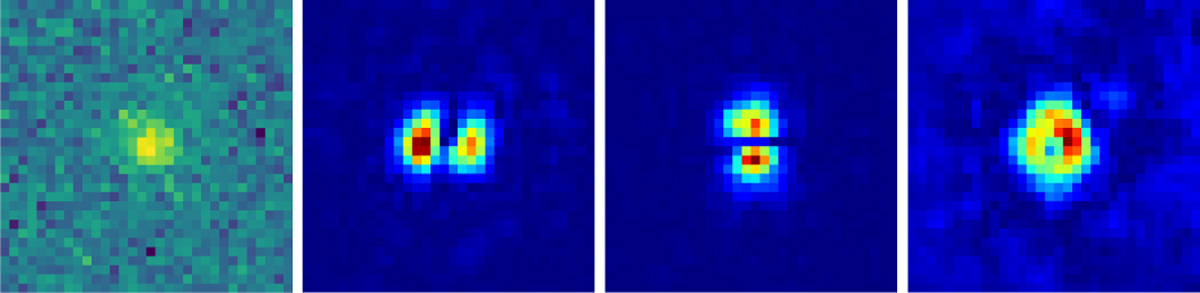
Saliency map of ASID-FE’s features prediction for a single source. The images are from left to right: original image, saliency for x, saliency for y, and saliency for flux. The colour map indicates the degree of importance assigned to each pixel in the image. The brighter the colour, the more important the pixel is for the prediction. As expected, the network mainly focuses on the source to determine its centre and flux while paying less attention to the edges of the image.
Current usage metrics show cumulative count of Article Views (full-text article views including HTML views, PDF and ePub downloads, according to the available data) and Abstracts Views on Vision4Press platform.
Data correspond to usage on the plateform after 2015. The current usage metrics is available 48-96 hours after online publication and is updated daily on week days.
Initial download of the metrics may take a while.