Fig. 3.
Download original image
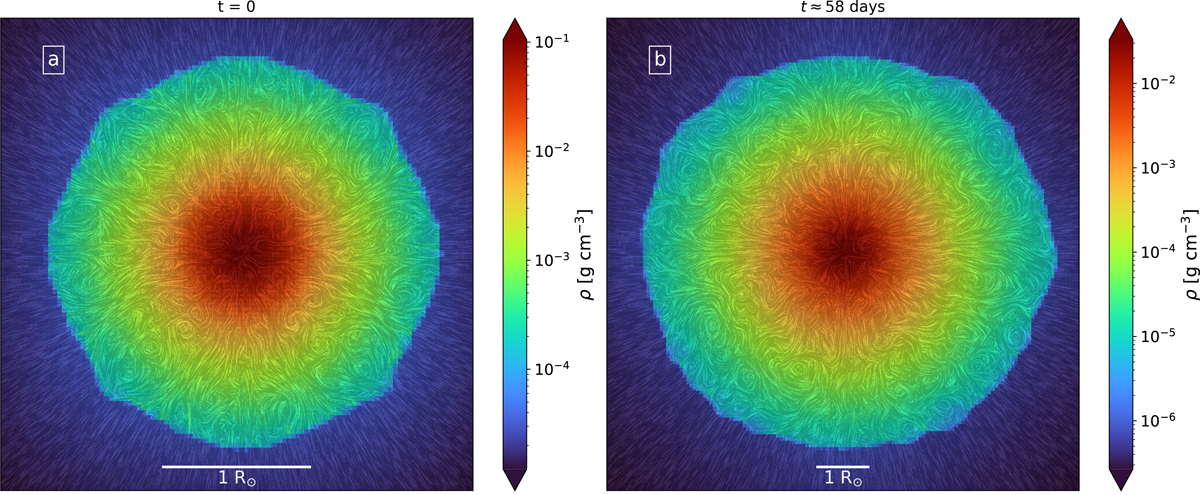
Density slices through the center of the domain at the birth of the protostar (t = 0, panel a) and roughly 2 months later (t ≈ 59 days, panel b). The swirly patterns are line integral convolution (LIC) visualizations of the velocity vector field, which display prominent eddies inside the newly formed protostar. Over the span of ≈2 months, the protostar has grown in radius by a factor ≈2.8.
Current usage metrics show cumulative count of Article Views (full-text article views including HTML views, PDF and ePub downloads, according to the available data) and Abstracts Views on Vision4Press platform.
Data correspond to usage on the plateform after 2015. The current usage metrics is available 48-96 hours after online publication and is updated daily on week days.
Initial download of the metrics may take a while.