Open Access
Fig. E.1.
Download original image
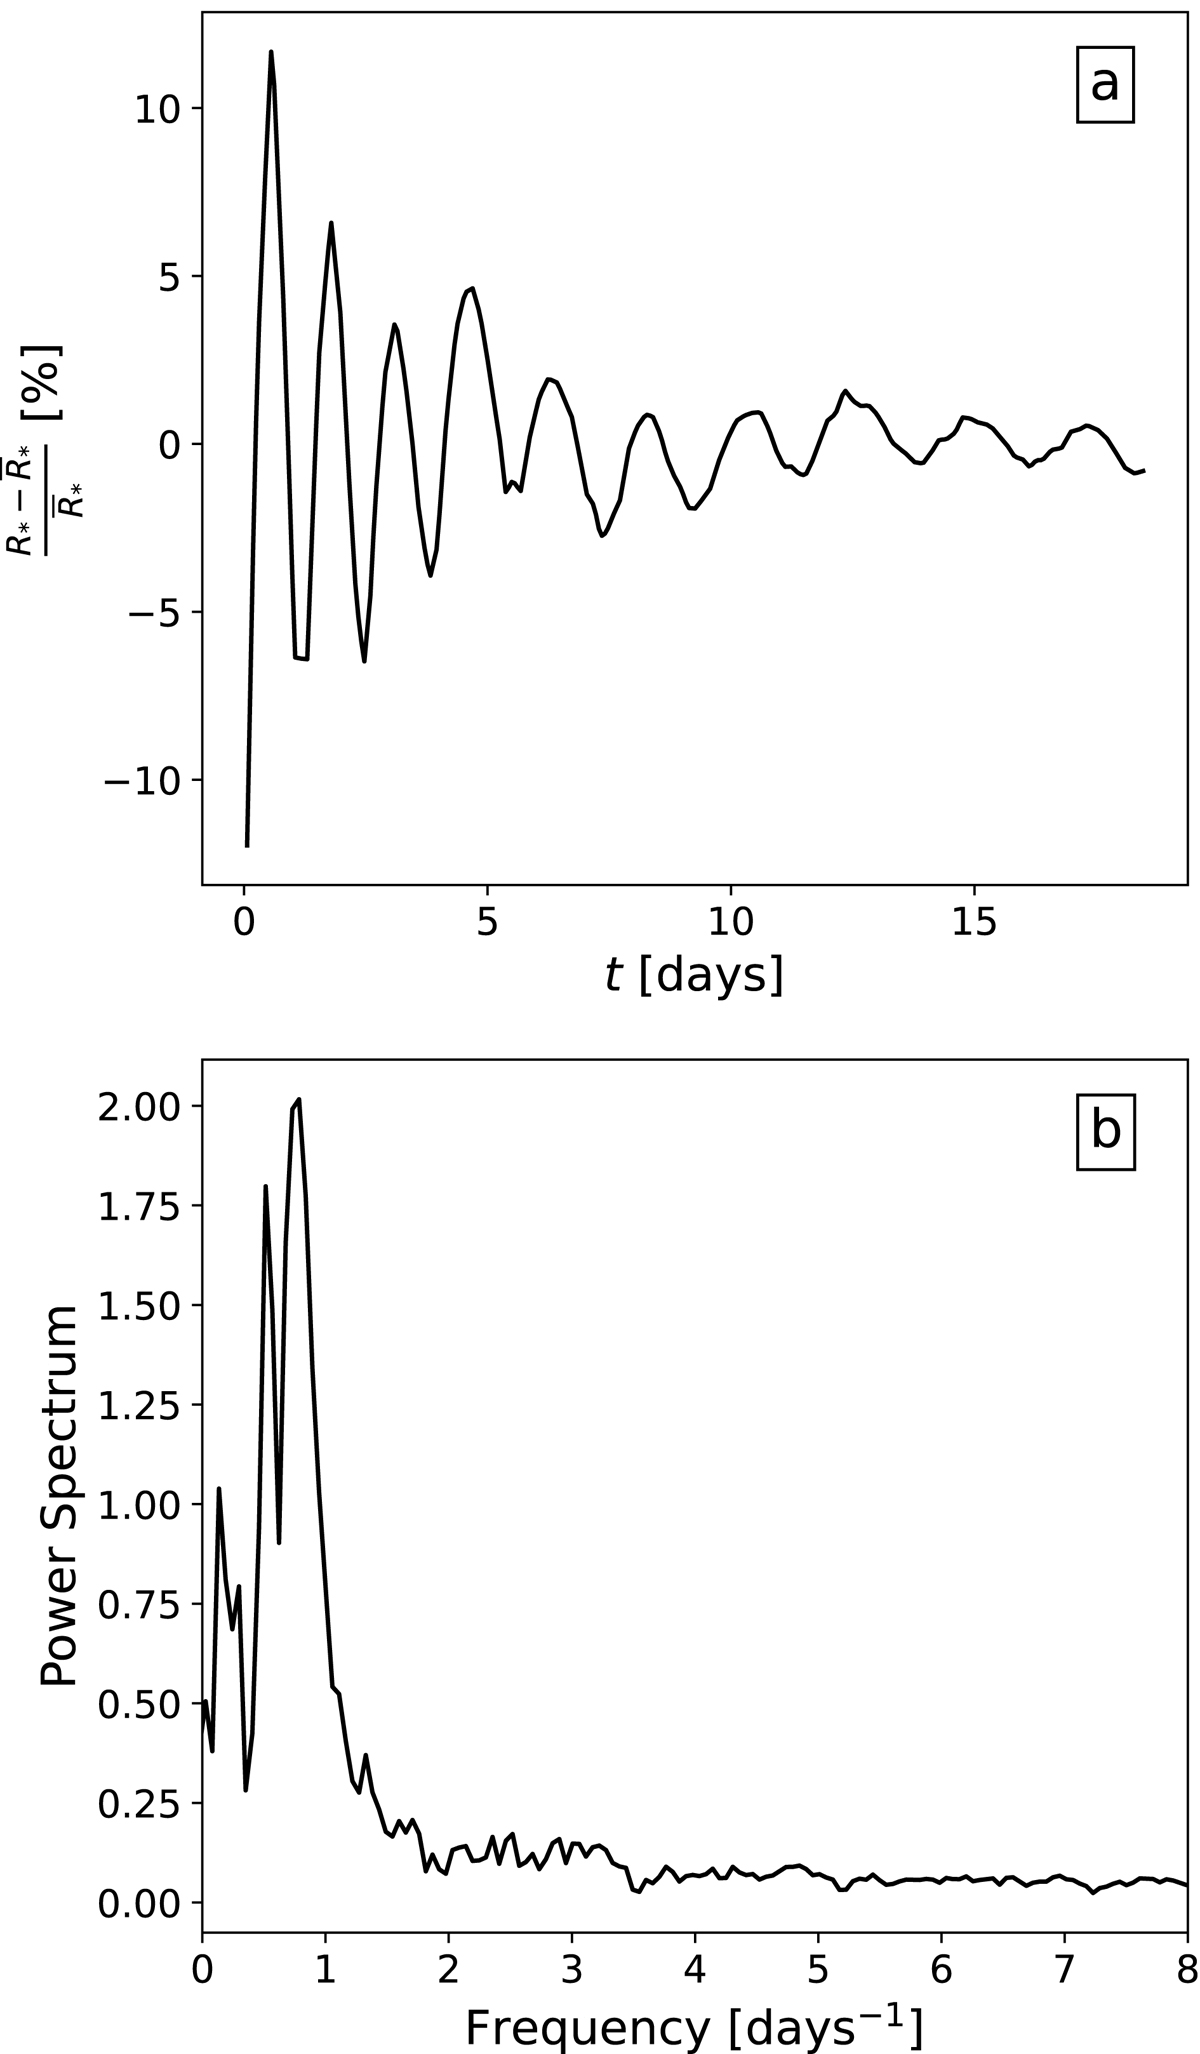
Amplitude of oscillations of the protostellar radius in the ℓmax = 27 run (panel a), displayed as a function of time where t = 0 marks the birth of the protostar. Panel (b) displays the Fourier transform of the curve in panel (a).
Current usage metrics show cumulative count of Article Views (full-text article views including HTML views, PDF and ePub downloads, according to the available data) and Abstracts Views on Vision4Press platform.
Data correspond to usage on the plateform after 2015. The current usage metrics is available 48-96 hours after online publication and is updated daily on week days.
Initial download of the metrics may take a while.