Open Access
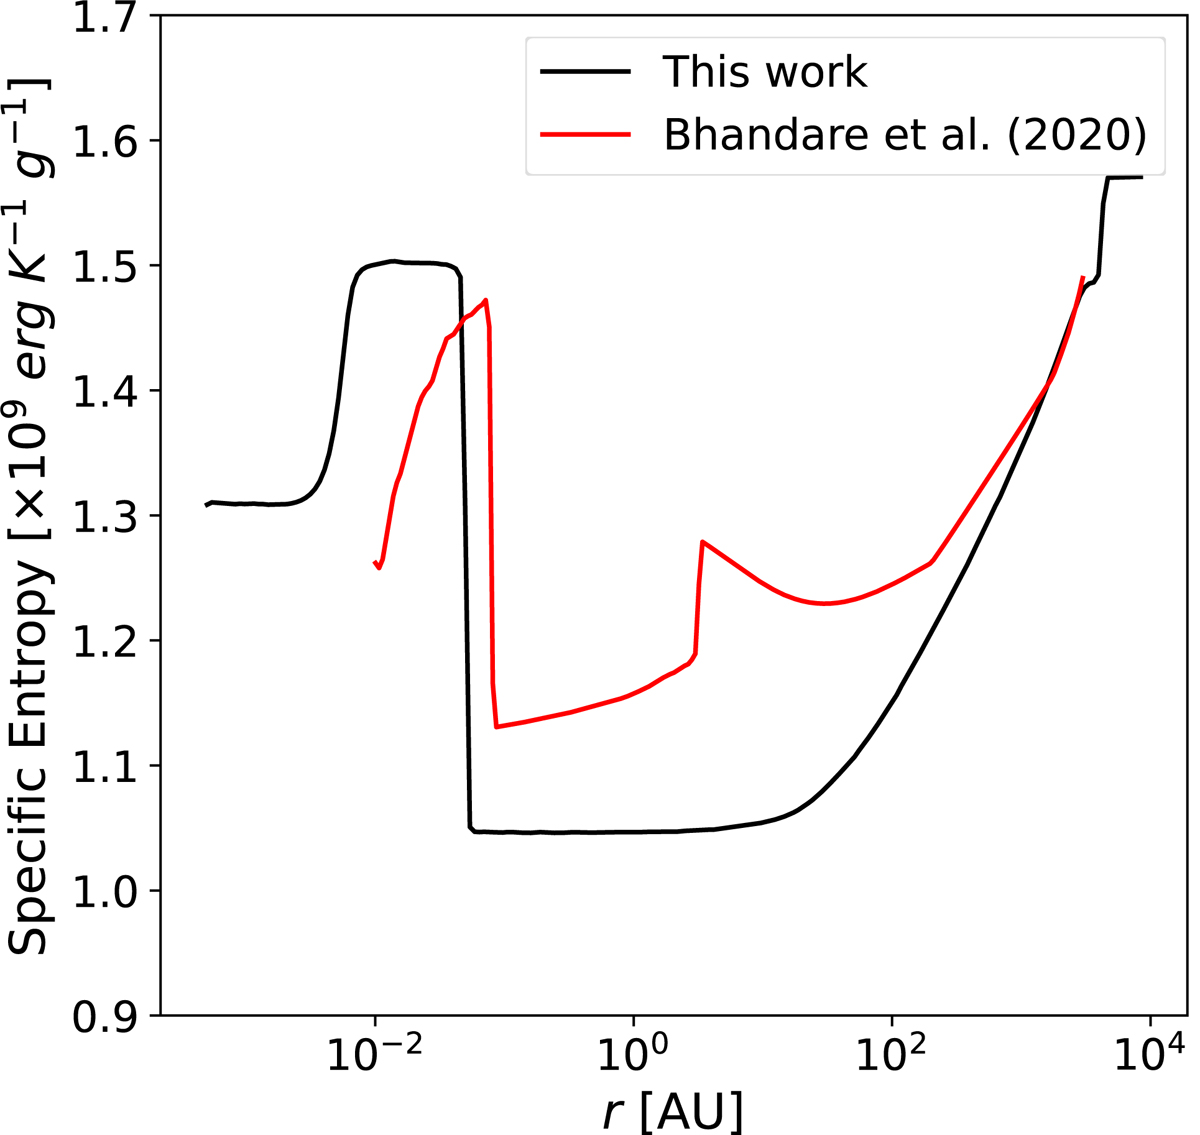
Fig. D.2.
Download original image
Comparison of the results of this paper (black curve) with those of Bhandare et al. (2020) (red curve). The curves display the specific entropy, averaged in radial bins and displayed as a function of radius, at a moment in time where both protostars have a mass of ≈1.76 × 10⁻² M⊙.
Current usage metrics show cumulative count of Article Views (full-text article views including HTML views, PDF and ePub downloads, according to the available data) and Abstracts Views on Vision4Press platform.
Data correspond to usage on the plateform after 2015. The current usage metrics is available 48-96 hours after online publication and is updated daily on week days.
Initial download of the metrics may take a while.