Open Access
Fig. C.2.
Download original image
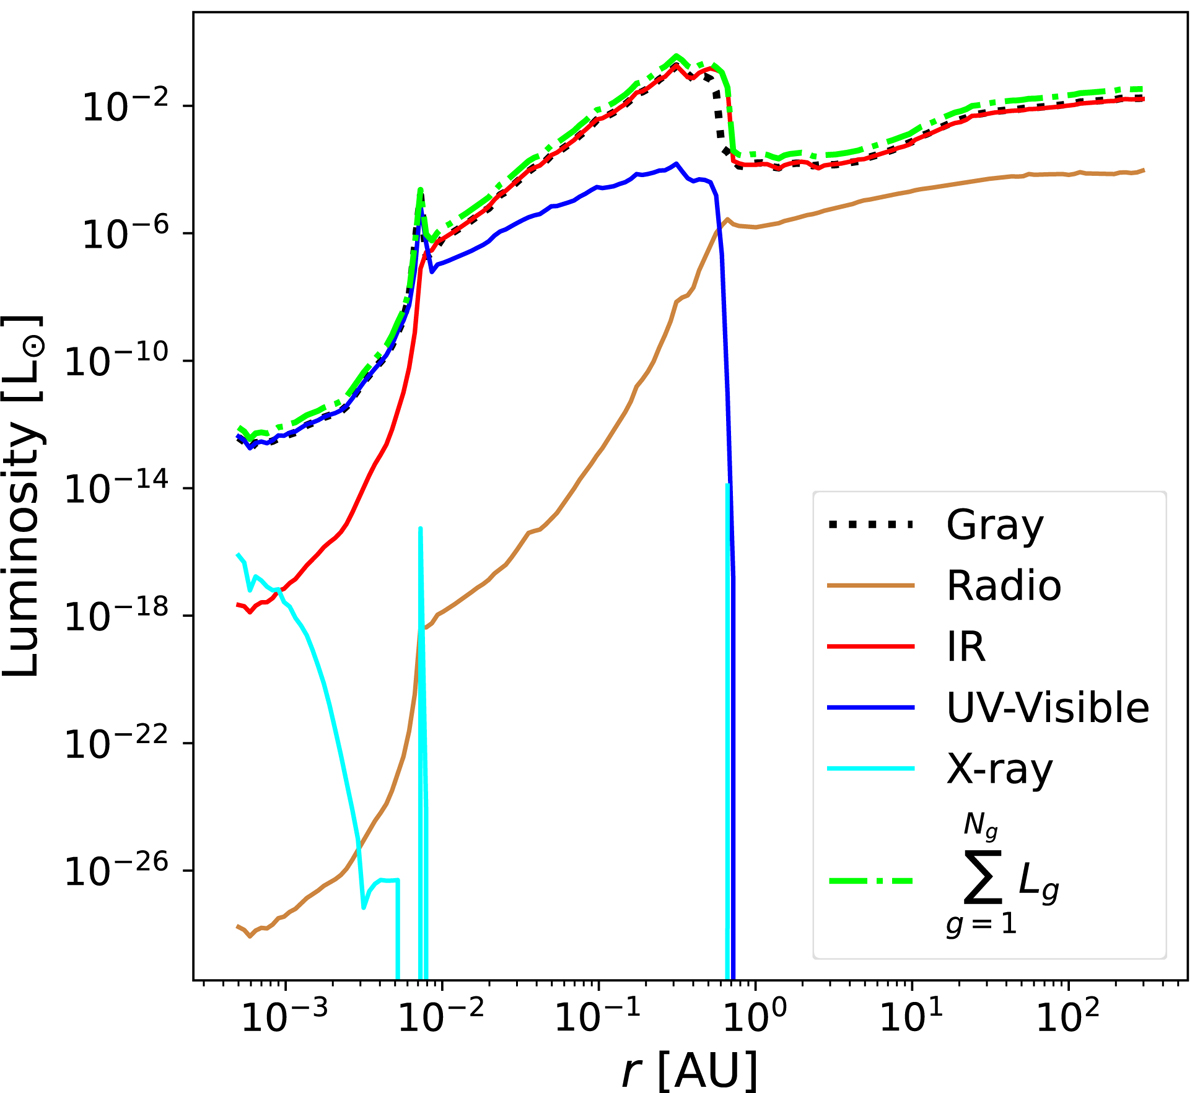
Luminosity profiles displayed as a function of radius at the epoch of the protostar’s birth for the gray radiative transfer simulation (dotted black line) and its multigroup counterpart (colored solid lines). The lime dash-dotted line is the total luminosity in the multigroup run.
Current usage metrics show cumulative count of Article Views (full-text article views including HTML views, PDF and ePub downloads, according to the available data) and Abstracts Views on Vision4Press platform.
Data correspond to usage on the plateform after 2015. The current usage metrics is available 48-96 hours after online publication and is updated daily on week days.
Initial download of the metrics may take a while.