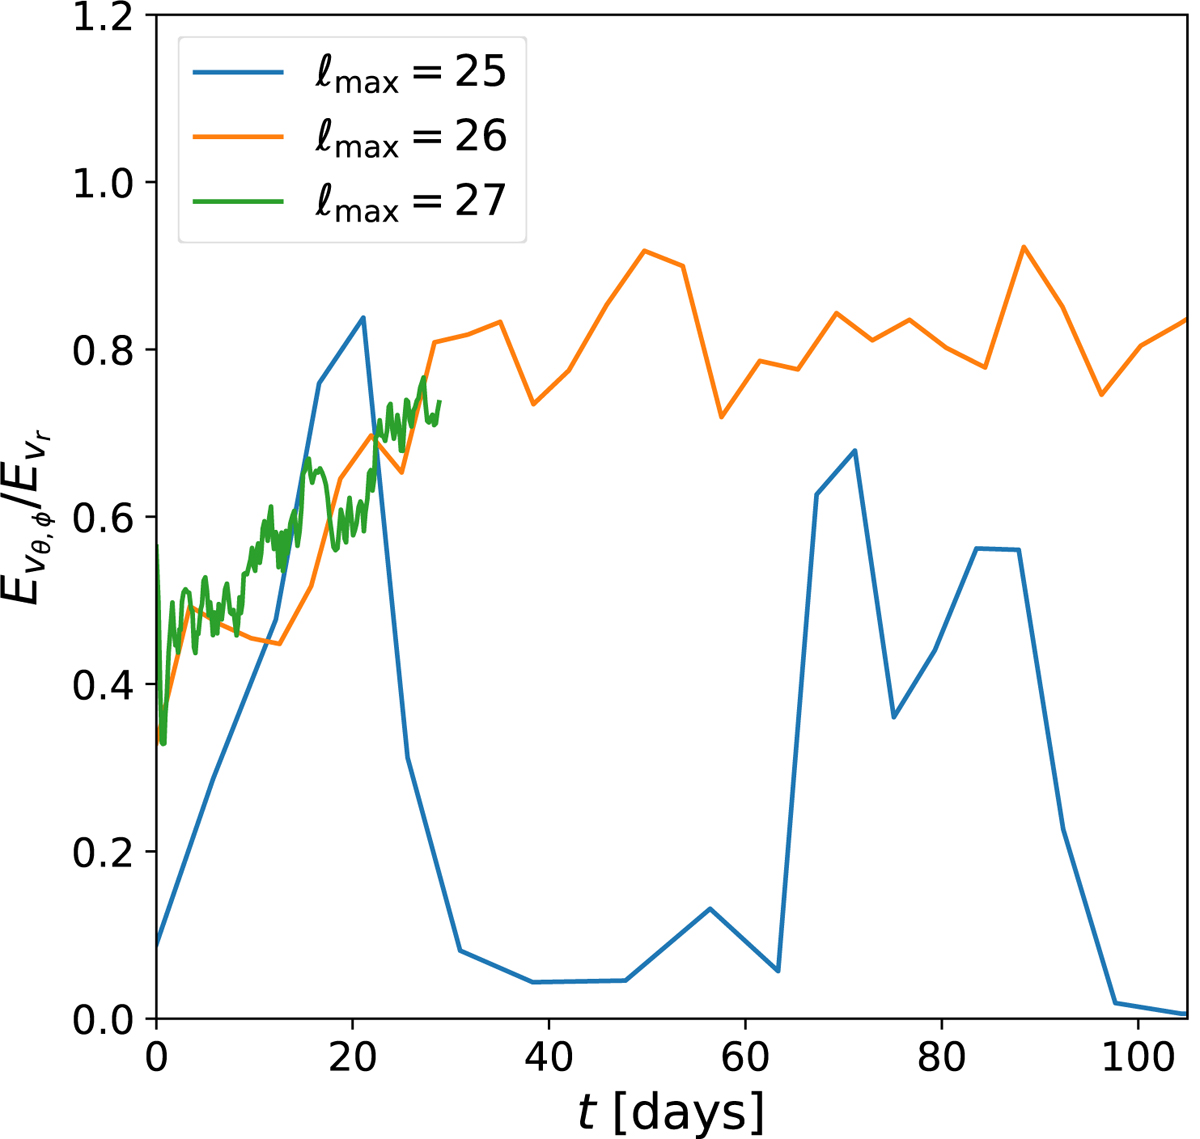
Fig. B.5.
Download original image
Kinetic energy of the ortho-radial flow compared to that of radial flow inside the protostar as a function of time, where t = 0 marks the birth of the protostar, for simulations with a maximum refinement level of 25 (Δx = 2.93 × 10⁻⁴AU, blue curve), 26 (Δx = 1.46 × 10⁻⁴AU, orange curve), and 27 (Δx = 7.34 × 10⁻⁵AU, green curve).
Current usage metrics show cumulative count of Article Views (full-text article views including HTML views, PDF and ePub downloads, according to the available data) and Abstracts Views on Vision4Press platform.
Data correspond to usage on the plateform after 2015. The current usage metrics is available 48-96 hours after online publication and is updated daily on week days.
Initial download of the metrics may take a while.