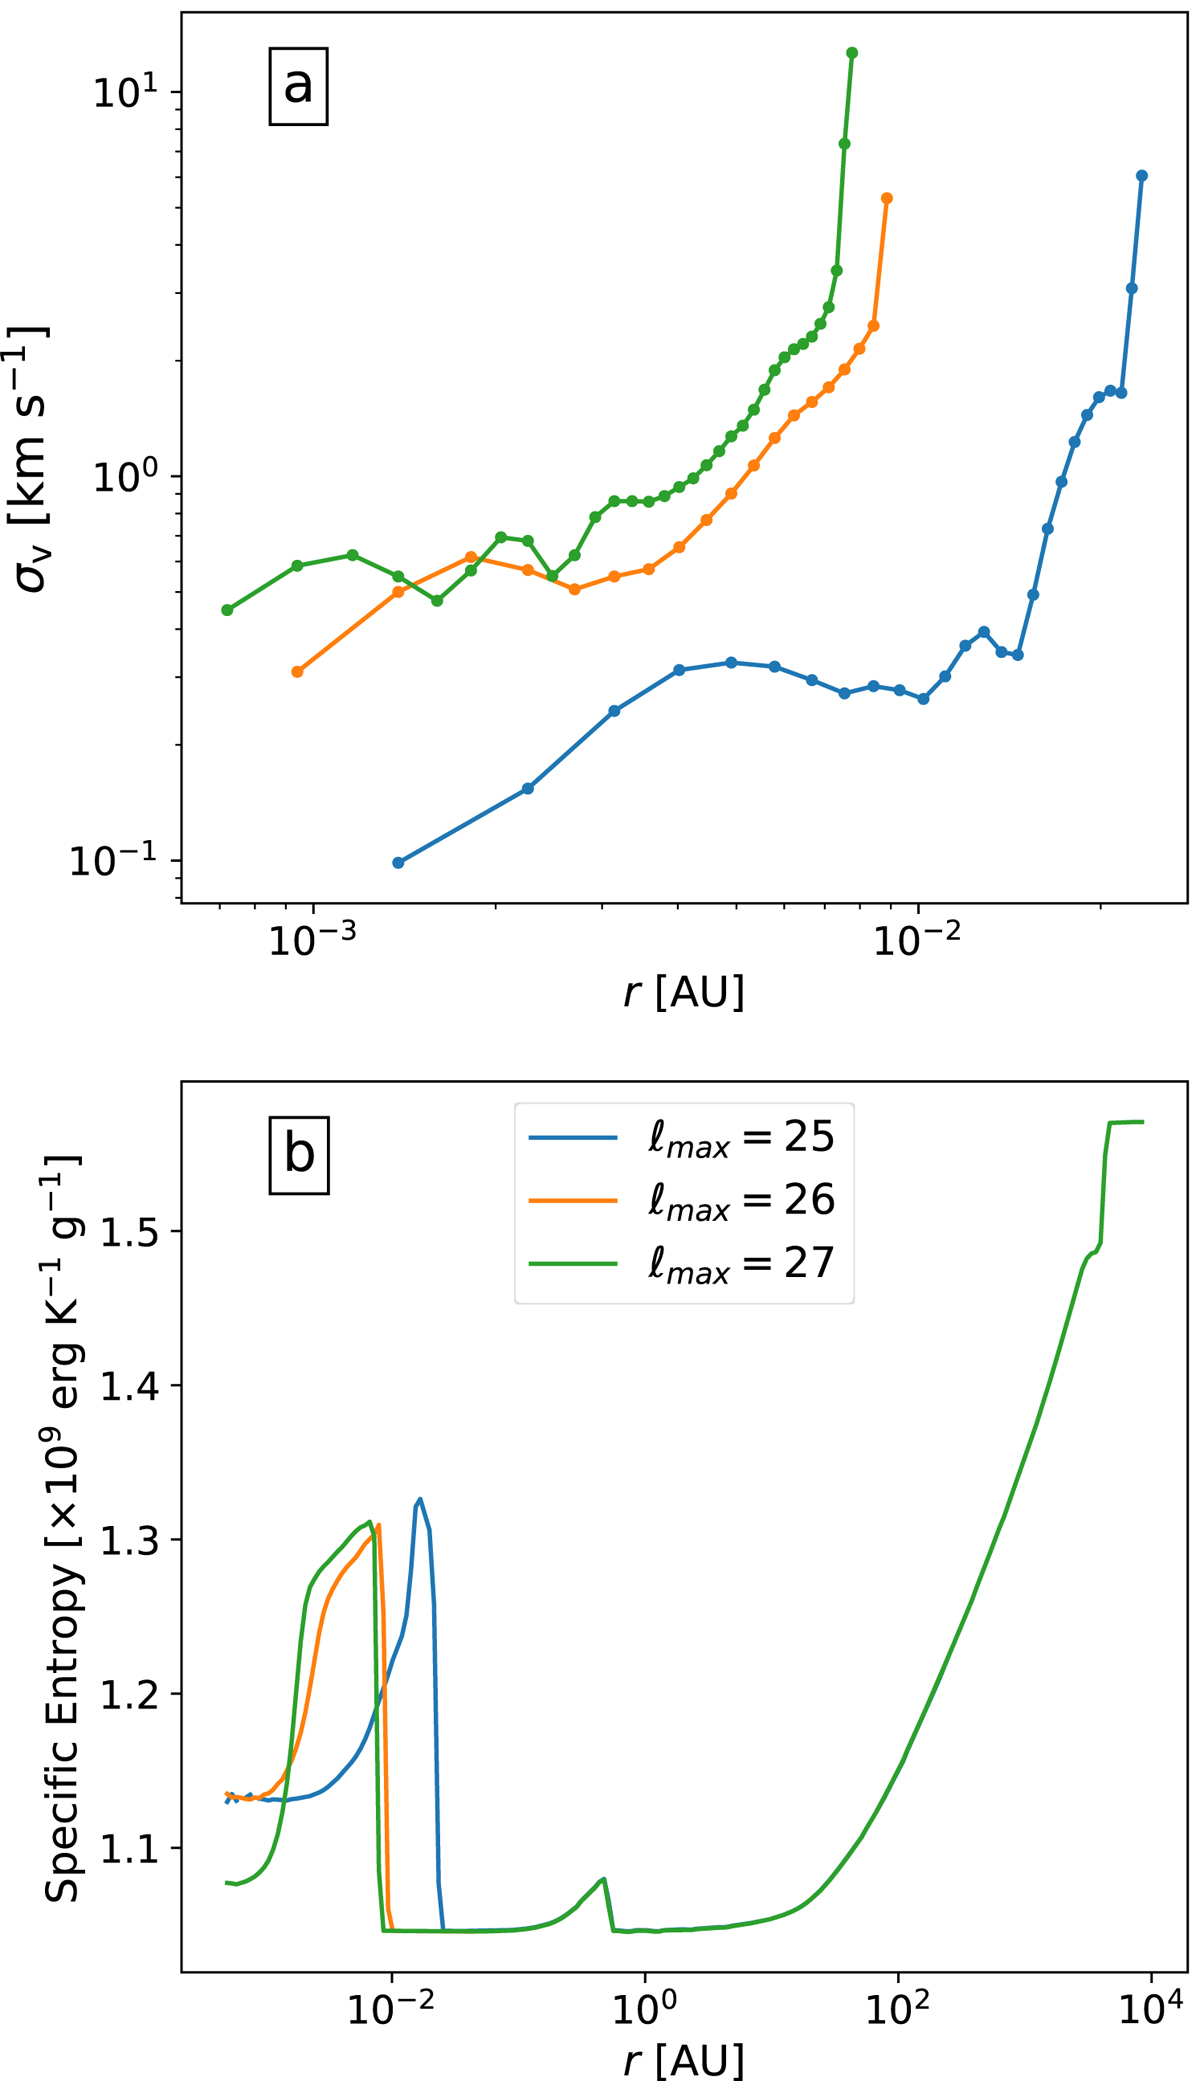
Fig. B.4.
Download original image
Velocity dispersion inside the protostar computed in radial bins (panel a) and average specific entropy (panel b), for simulations with a maximum refinement level of 25 (Δx = 2.93 × 10⁻⁴AU, blue curves), 26 (Δx = 1.46 × 10⁻⁴AU, orange curves), and 27 (Δx = 7.34 × 10⁻⁵AU, green curves). These are shown at a moment in time where all three protostars have reached similar masses (5.9 × 10⁻³ M⊙ for ℓmax = 25, 5.75 × 10⁻³ M⊙ for ℓmax = 26 and ℓmax = 27).
Current usage metrics show cumulative count of Article Views (full-text article views including HTML views, PDF and ePub downloads, according to the available data) and Abstracts Views on Vision4Press platform.
Data correspond to usage on the plateform after 2015. The current usage metrics is available 48-96 hours after online publication and is updated daily on week days.
Initial download of the metrics may take a while.