Fig. 15.
Download original image
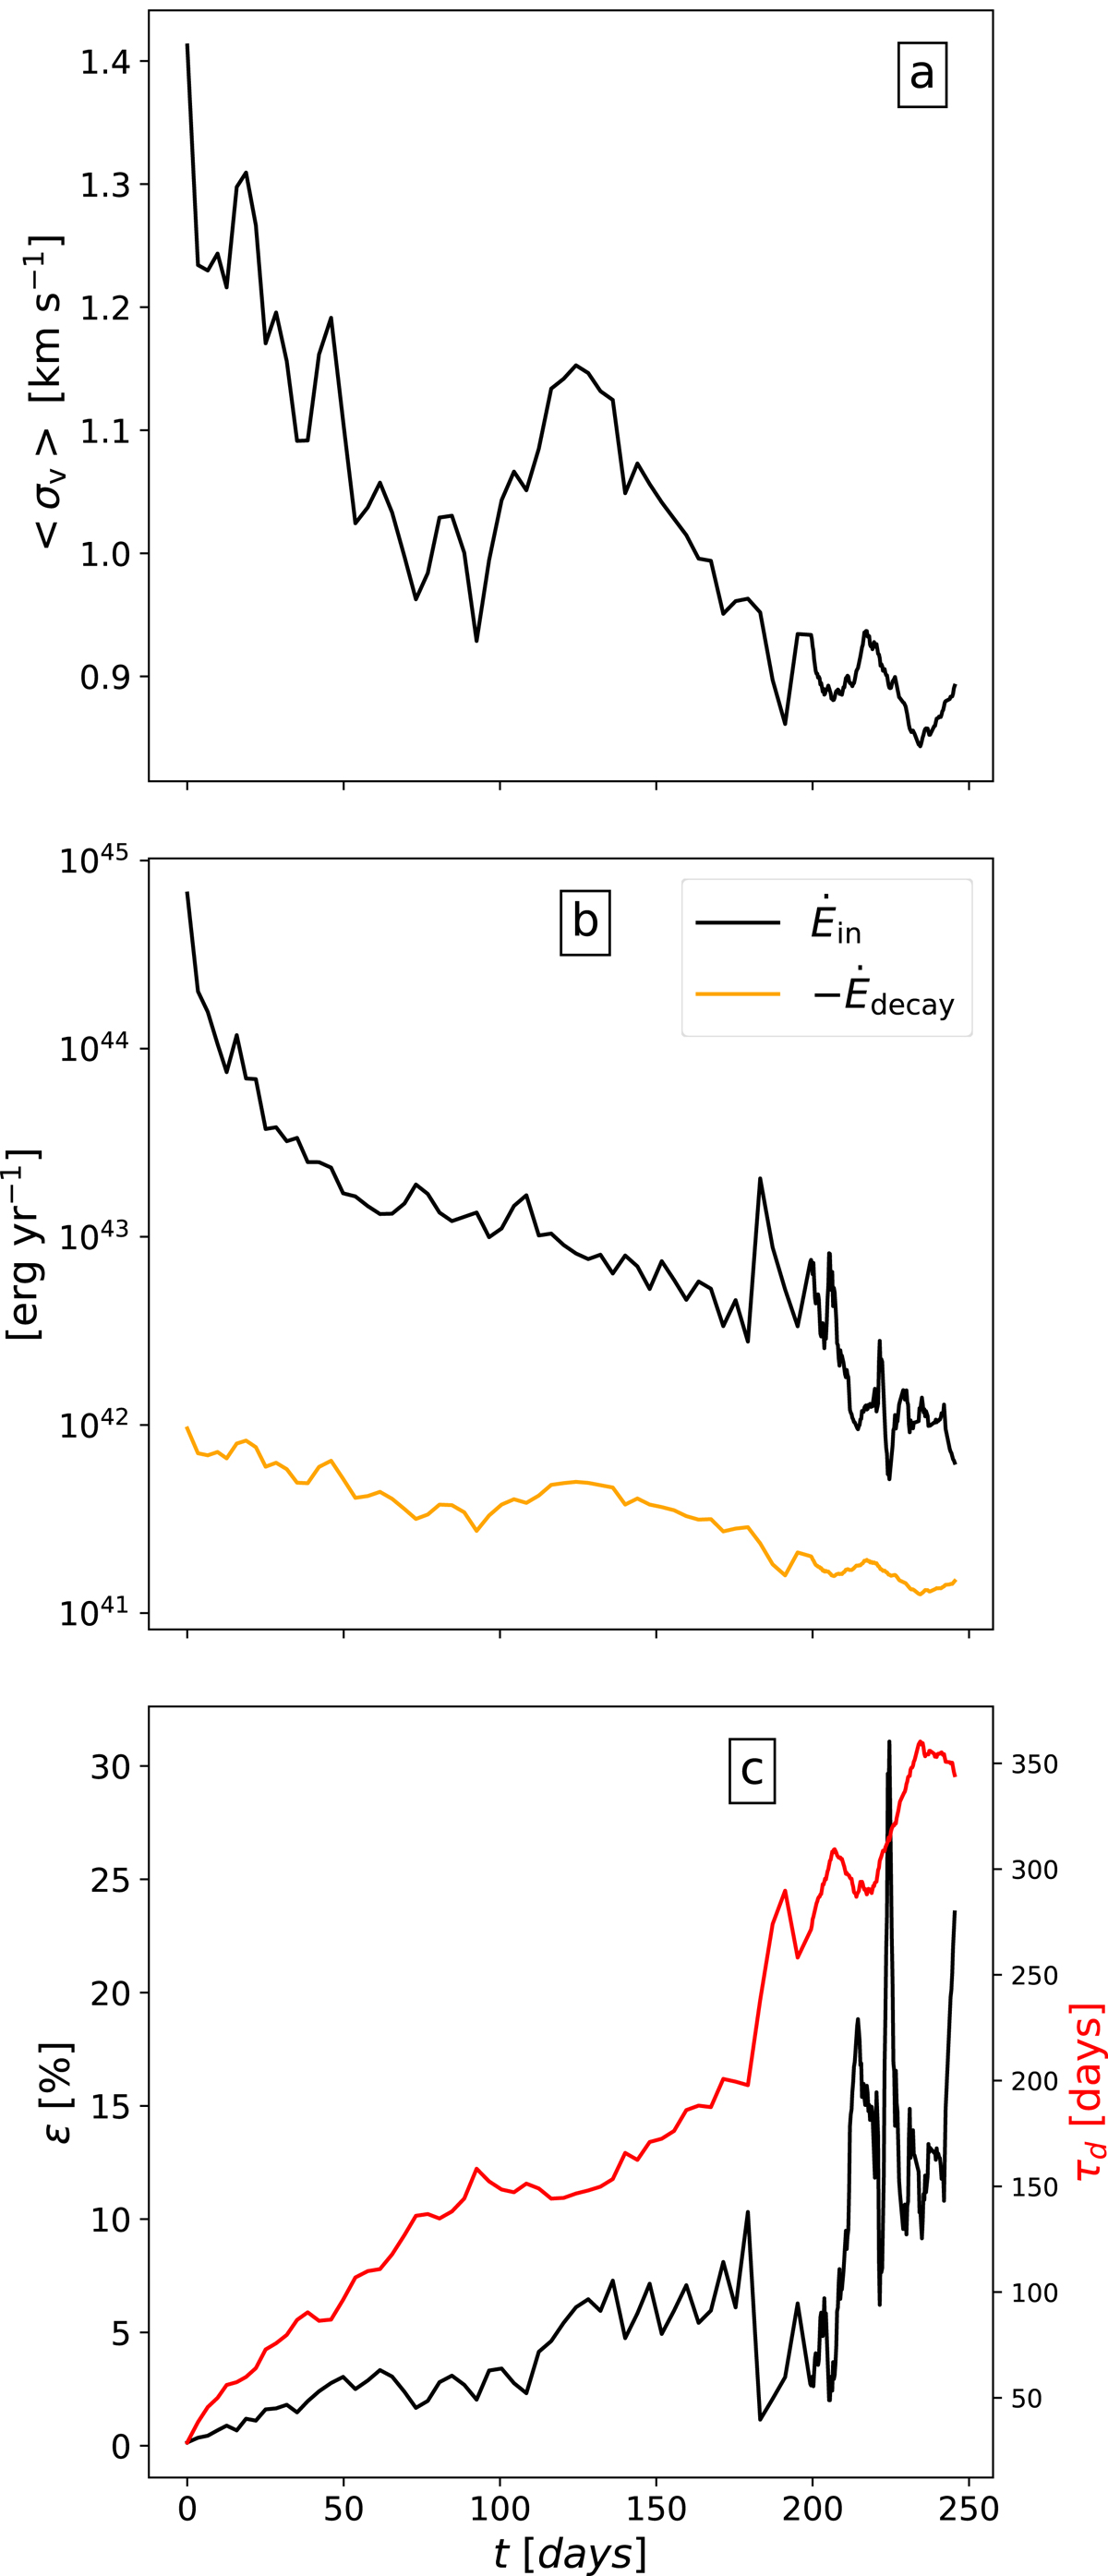
Mass-weighted velocity dispersion inside the protostar (panel a), injected accretion energy alongside the turbulence decay (panel b), and efficiency factor (panel c) displayed as a function of time, where t = 0 marks the birth of the protostar. The red line in panel c corresponds to the turbulence crossing time (see Eq. (25)).
Current usage metrics show cumulative count of Article Views (full-text article views including HTML views, PDF and ePub downloads, according to the available data) and Abstracts Views on Vision4Press platform.
Data correspond to usage on the plateform after 2015. The current usage metrics is available 48-96 hours after online publication and is updated daily on week days.
Initial download of the metrics may take a while.