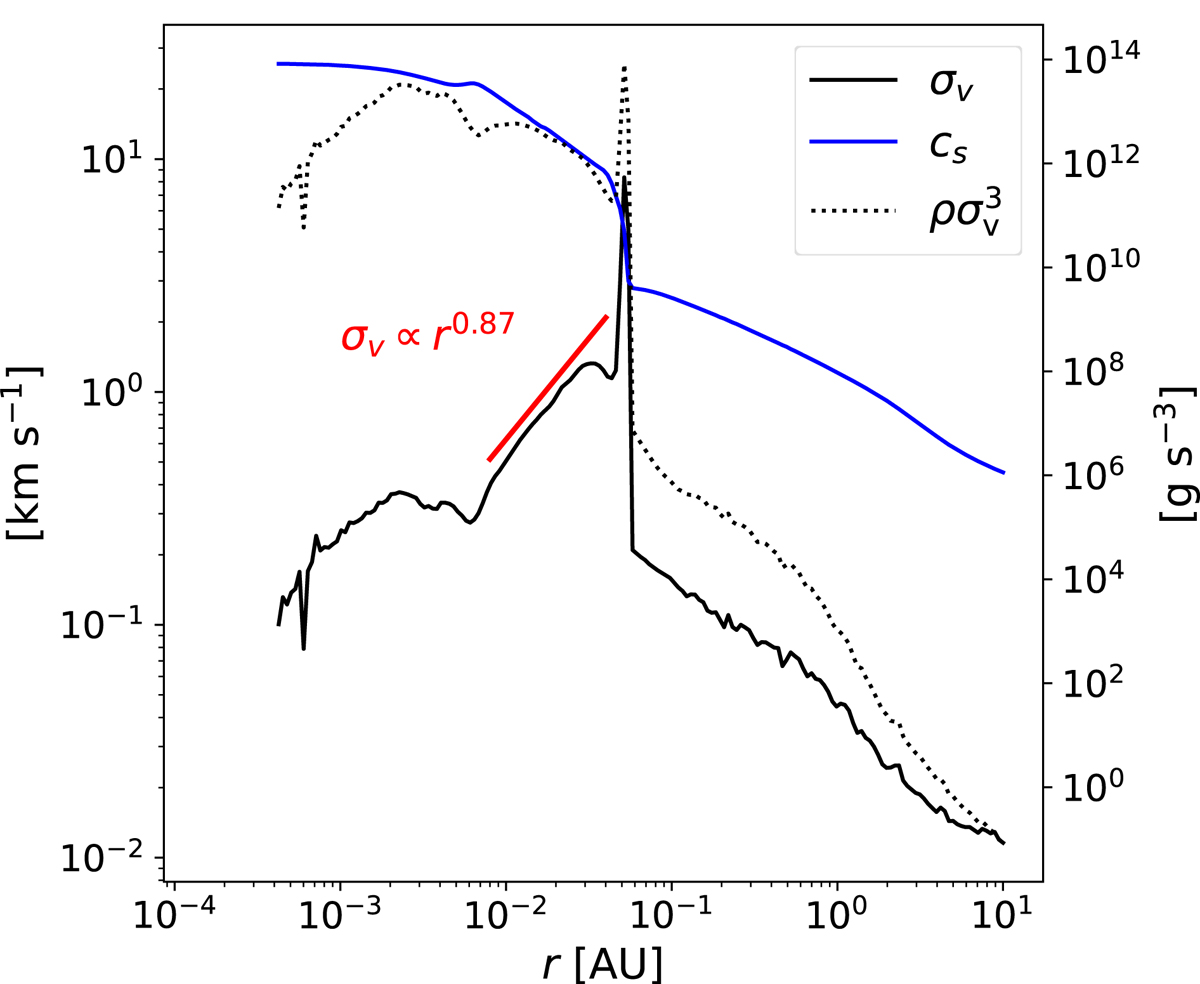
Fig. 14.
Download original image
Velocity dispersion computed in radial bins (black curve) and average local sound speed (blue curve), displayed as a function of radius at our last simulation snapshot (t ≈ 241 days, where t = 0 marks the birth of the protostar). The red curve is a fit of the inertial range, whose exponent is ≈9/10. The black dotted curve represents the turbulent energy flux (displayed in units of g s−3).
Current usage metrics show cumulative count of Article Views (full-text article views including HTML views, PDF and ePub downloads, according to the available data) and Abstracts Views on Vision4Press platform.
Data correspond to usage on the plateform after 2015. The current usage metrics is available 48-96 hours after online publication and is updated daily on week days.
Initial download of the metrics may take a while.