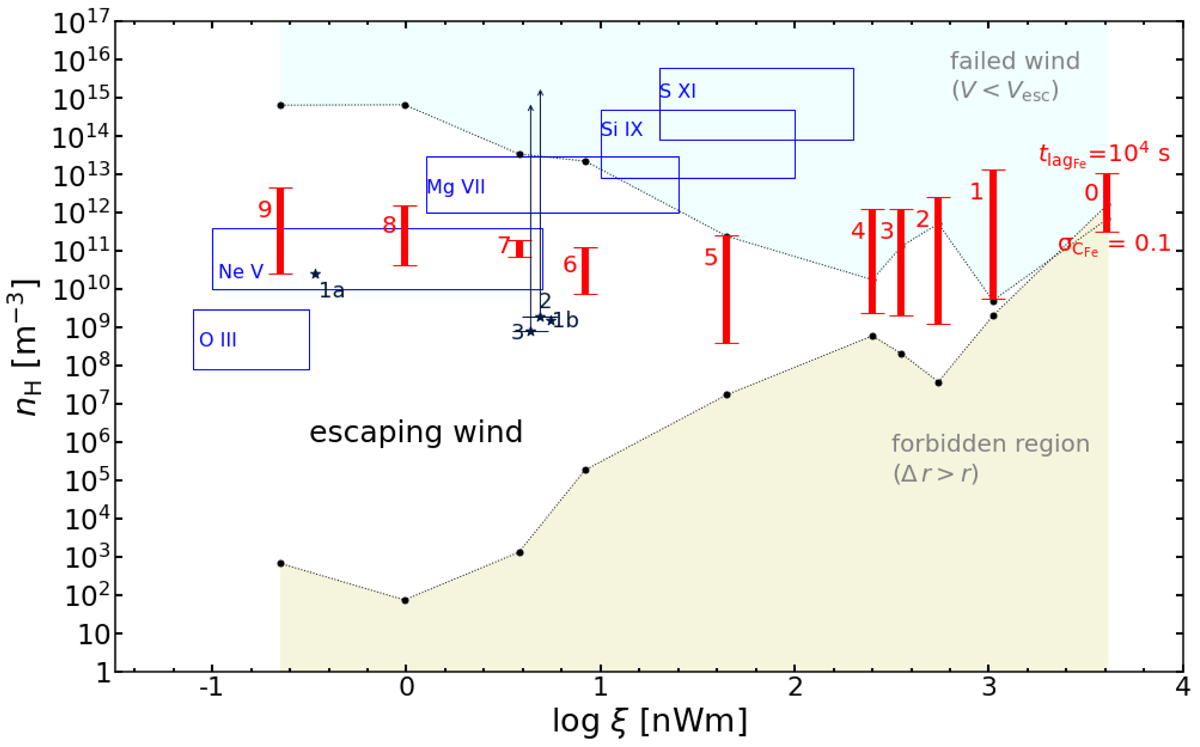
Fig. 8.
Download original image
Detectable density ranges of 10 X-ray WA components in the unobscured state of NGC 3783. The 10 WAs are marked in red. Upper black points and line: outflow velocity equals the escape velocity. For higher densities, winds cannot escape i.e., they are failed winds as shown in the light azure shaded region. Lower black points and line: the thickness of the wind equals its distance to the core. For lower densities, no solution exists, i.e., forbidden region shown in the yellow region. Red vertical solid lines: the detectable density range by the tpho-delay method for all 10 X-ray WAs. The upper limit: lag equals 104 s. For higher densities, lags are shorter and more difficult to measure due to photon statistics. The lower limit: relative variations of the charge of Fe ions is 10%. For lower densities, variations become too small to measure. Navy stars and lines with labels 1a–3: density measurements or lower limits from Gabel et al. (2005). ξ values converted for models with the SED of Mehdipour et al. (2017). Rectangular boxes: regions where density-sensitive X-ray lines can be used to measure densities.
Current usage metrics show cumulative count of Article Views (full-text article views including HTML views, PDF and ePub downloads, according to the available data) and Abstracts Views on Vision4Press platform.
Data correspond to usage on the plateform after 2015. The current usage metrics is available 48-96 hours after online publication and is updated daily on week days.
Initial download of the metrics may take a while.