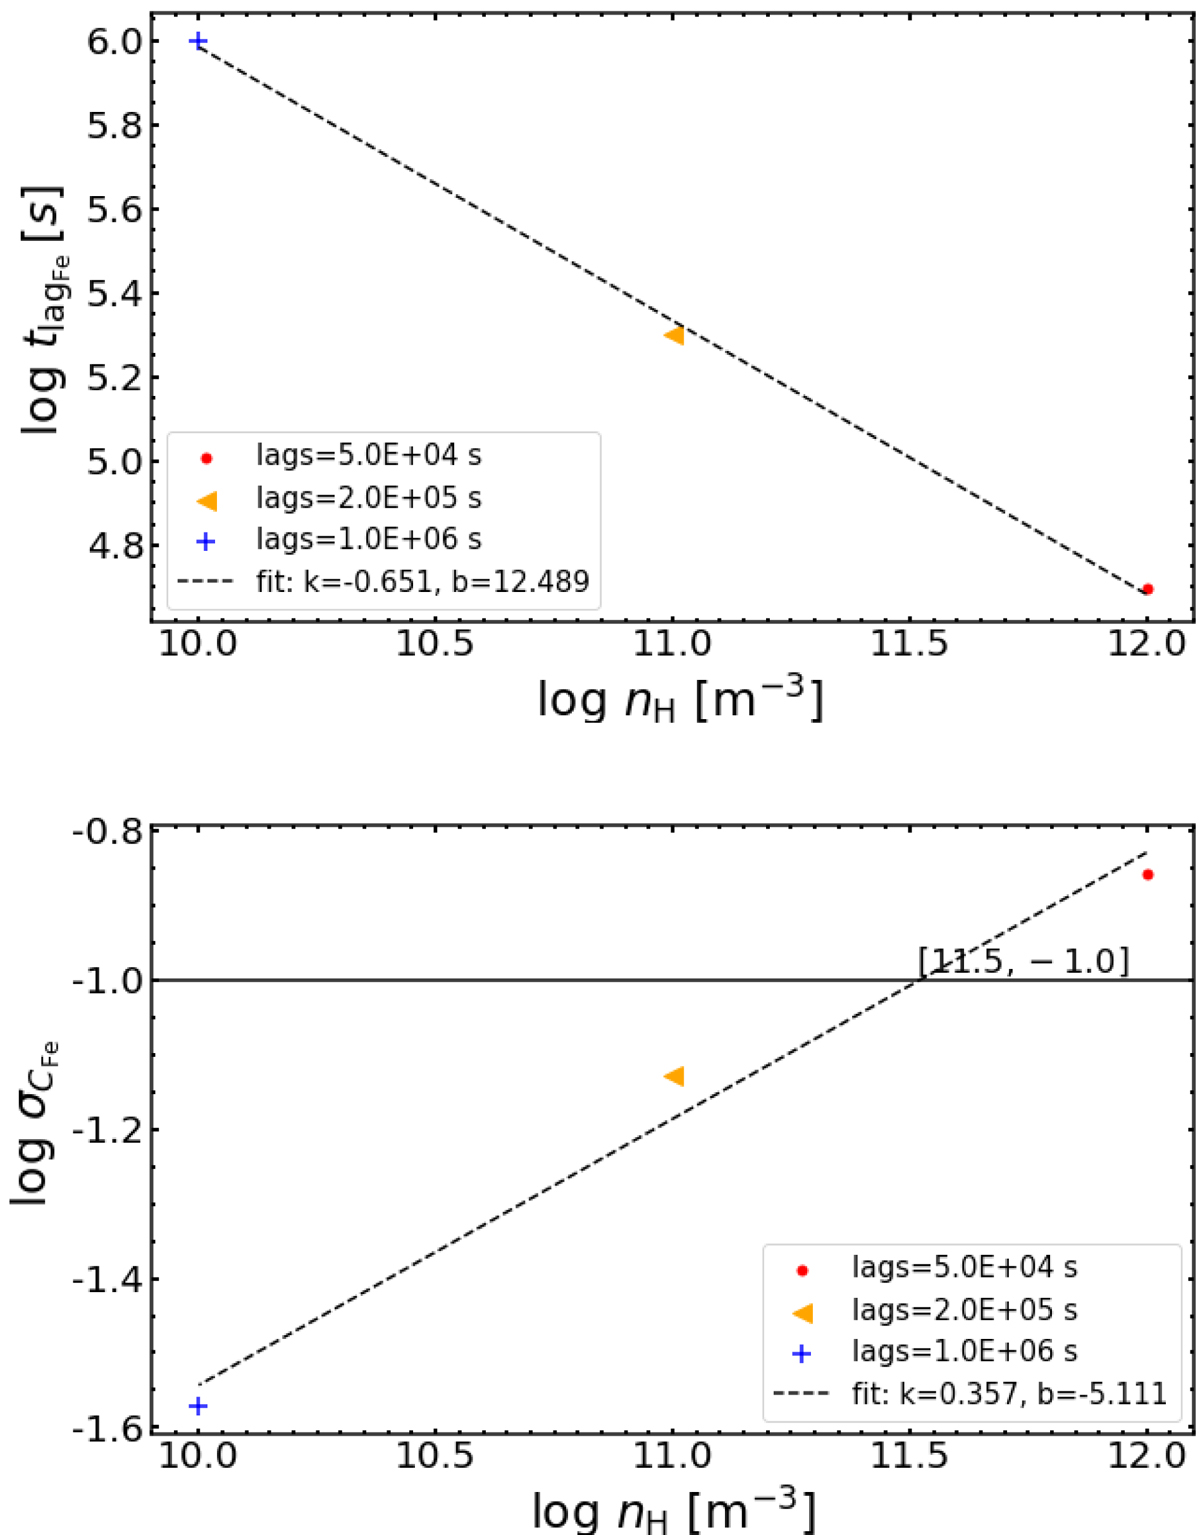
Fig. 7.
Download original image
Lag timescale and root-mean-square of average charge as a function of density for component 0 of NGC 3783 are presented in logarithmic. Top: lag timescale calculated from Fig. 6 vs. hydrogen number density in the unit of m−3. The fitting results are shown as a dashed line. Bottom: root-mean square σC of Fe average charge vs. hydrogen number density. The intersection between σC = −1.0 (horizontal black line) and the fitting results (dashed line) indicate the detectable lower limit.
Current usage metrics show cumulative count of Article Views (full-text article views including HTML views, PDF and ePub downloads, according to the available data) and Abstracts Views on Vision4Press platform.
Data correspond to usage on the plateform after 2015. The current usage metrics is available 48-96 hours after online publication and is updated daily on week days.
Initial download of the metrics may take a while.