Fig. 6.
Download original image
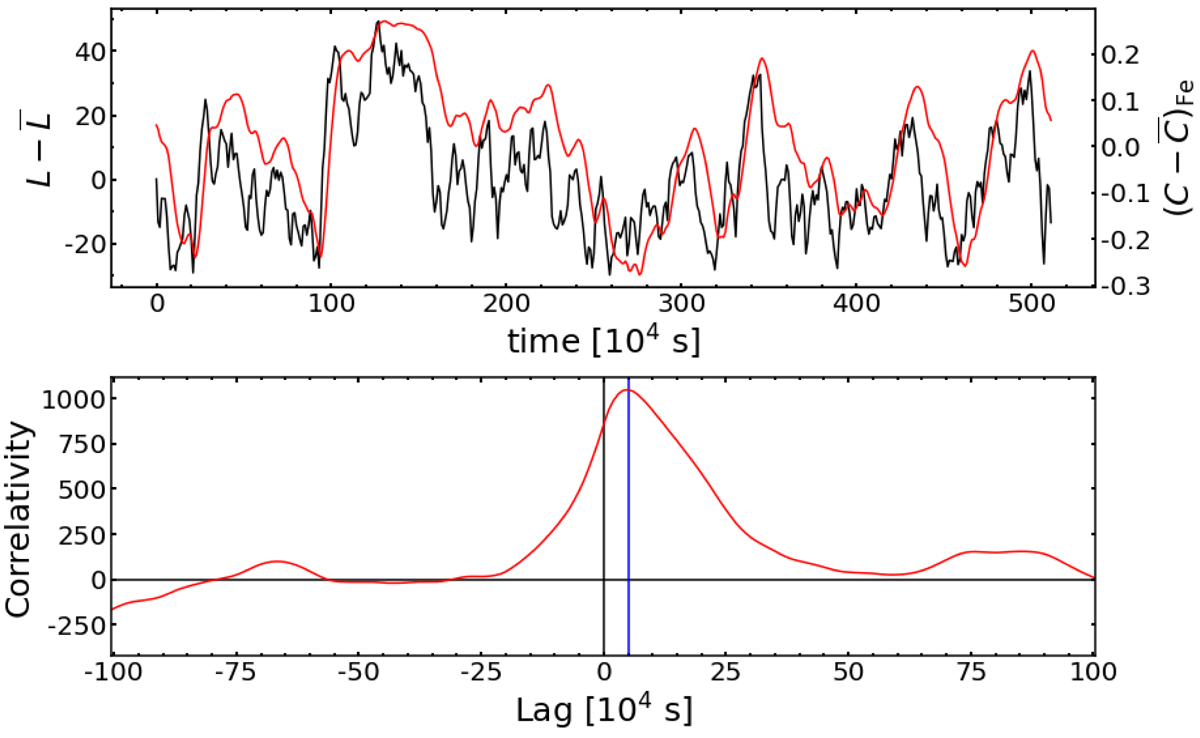
Cross correlation of the Fe average charge with ionising luminosity for component 0 of NGC 3783. Top panel: Fe mean-subtracted average change (red curve) from the tpho calculation with a hydrogen number density of 1012 m−3 and an ionising luminosity in black (tbin = 104 s). Bottom: correlativity from CCF versus lag. The blue vertical line marks the lag timescale of 5 × 10⁴ s corresponding to the largest correlativity.
Current usage metrics show cumulative count of Article Views (full-text article views including HTML views, PDF and ePub downloads, according to the available data) and Abstracts Views on Vision4Press platform.
Data correspond to usage on the plateform after 2015. The current usage metrics is available 48-96 hours after online publication and is updated daily on week days.
Initial download of the metrics may take a while.