Fig. 7.
Download original image
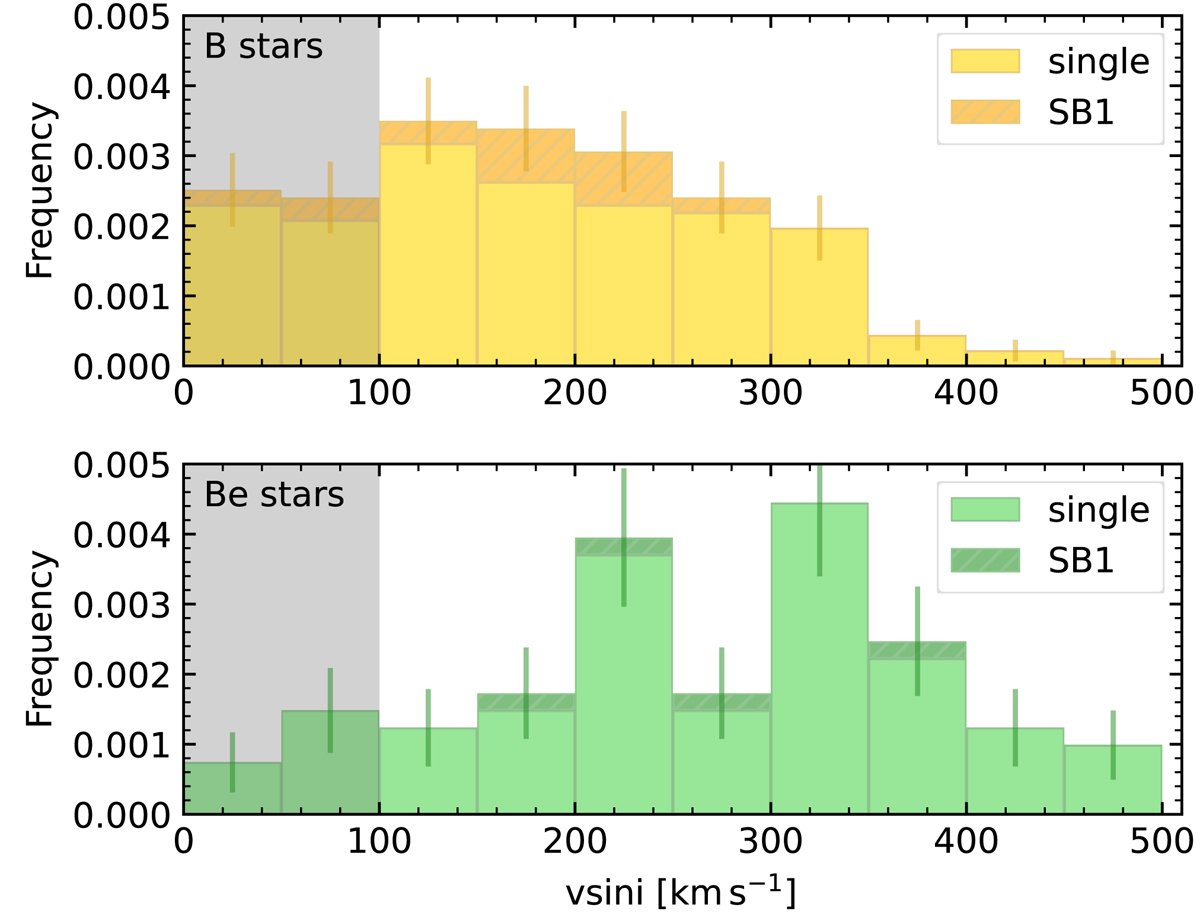
Stacked histogram of the projected rotational velocities of presumably single stars and SB1s. The top panel shows the B-type stars (single stars in yellow, SB1s in orange) and the bottom panel shows Be stars (single stars in light green, SB1s in dark green). The gray shaded region again corresponds to the formal MUSE sensitivity limit while the indicated errors are counting errors.
Current usage metrics show cumulative count of Article Views (full-text article views including HTML views, PDF and ePub downloads, according to the available data) and Abstracts Views on Vision4Press platform.
Data correspond to usage on the plateform after 2015. The current usage metrics is available 48-96 hours after online publication and is updated daily on week days.
Initial download of the metrics may take a while.