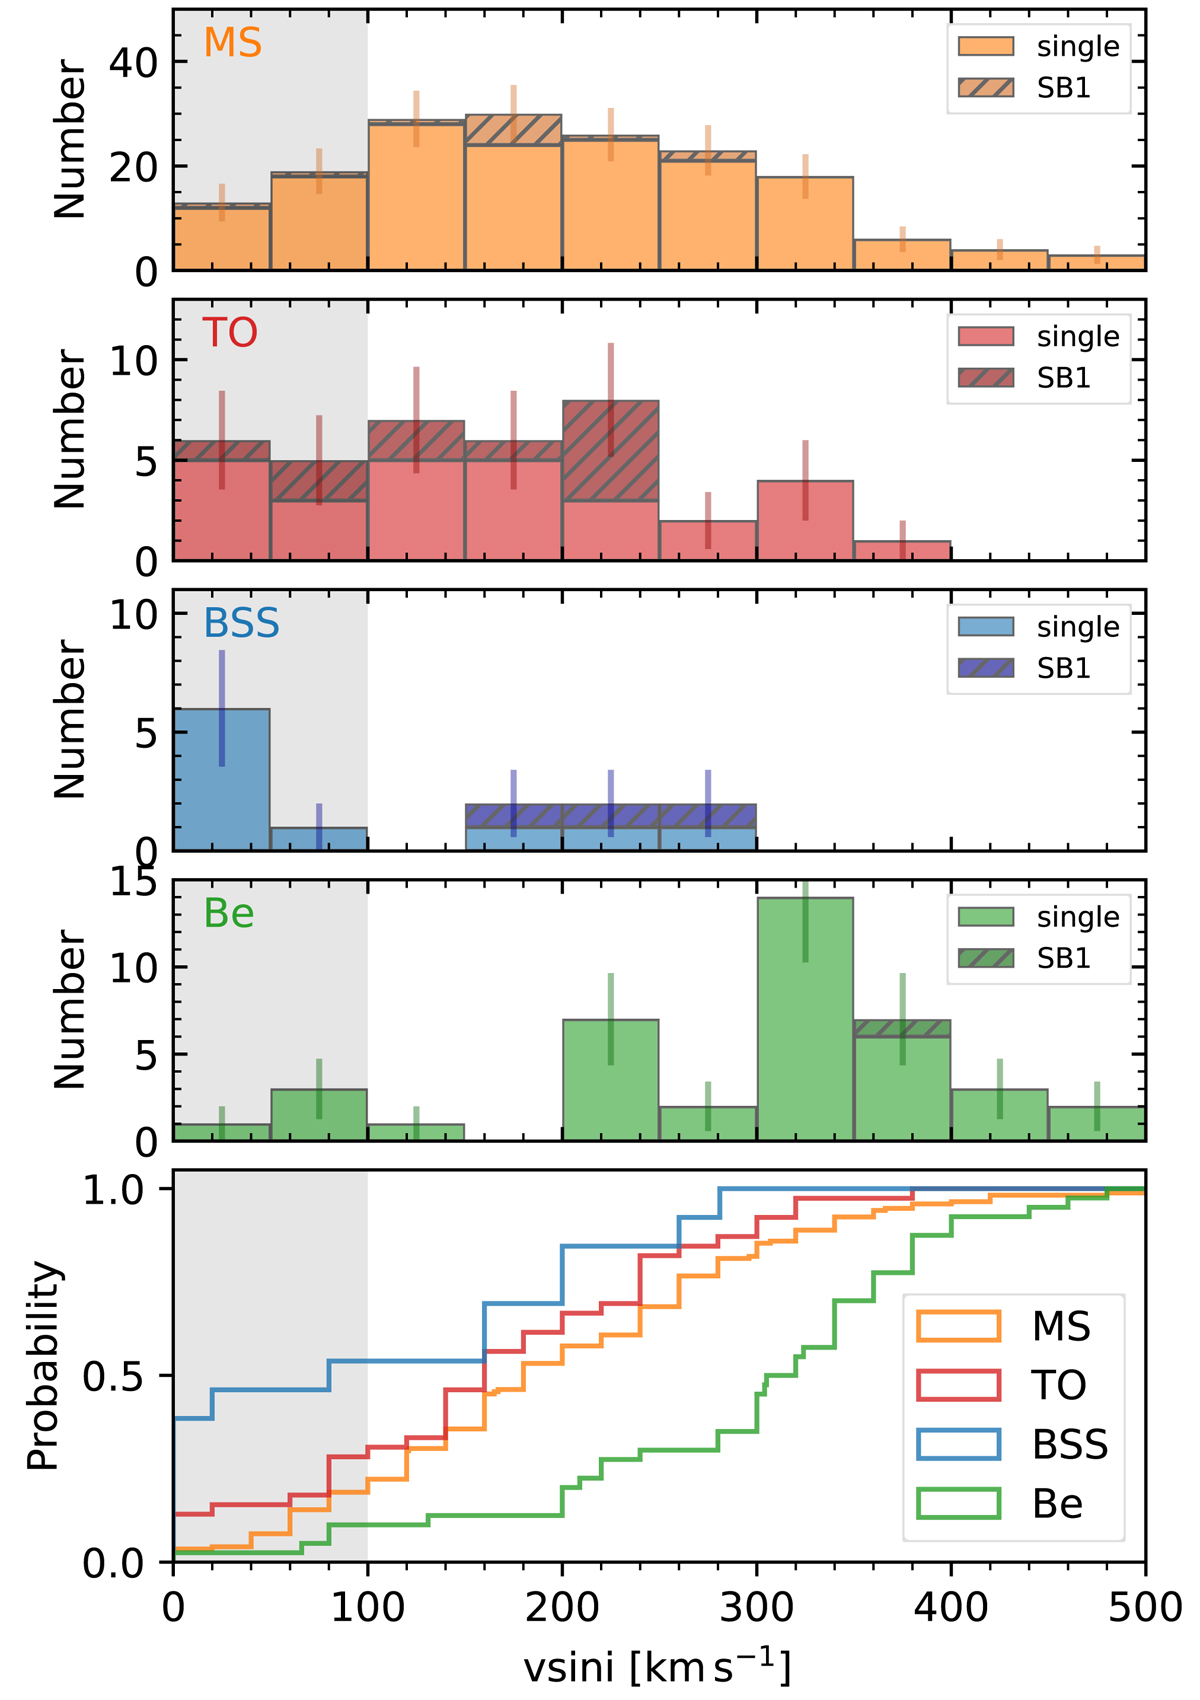
Fig. 10.
Download original image
Projected rotational velocities of different stellar groups, defined based on the CMD (see Fig. 8). Top four panels: from top to bottom, the panels show the v sin i distributions of star in the MS region, the TO region, the BSS region and the Be star region. In each panel, the detected SB1s are marked by a darker color, as indicated in the legend. Bottom panel: normalized cumulative distribution of the rotation rates of different groups, as indicated in the legend.
Current usage metrics show cumulative count of Article Views (full-text article views including HTML views, PDF and ePub downloads, according to the available data) and Abstracts Views on Vision4Press platform.
Data correspond to usage on the plateform after 2015. The current usage metrics is available 48-96 hours after online publication and is updated daily on week days.
Initial download of the metrics may take a while.