Fig. 3
Download original image
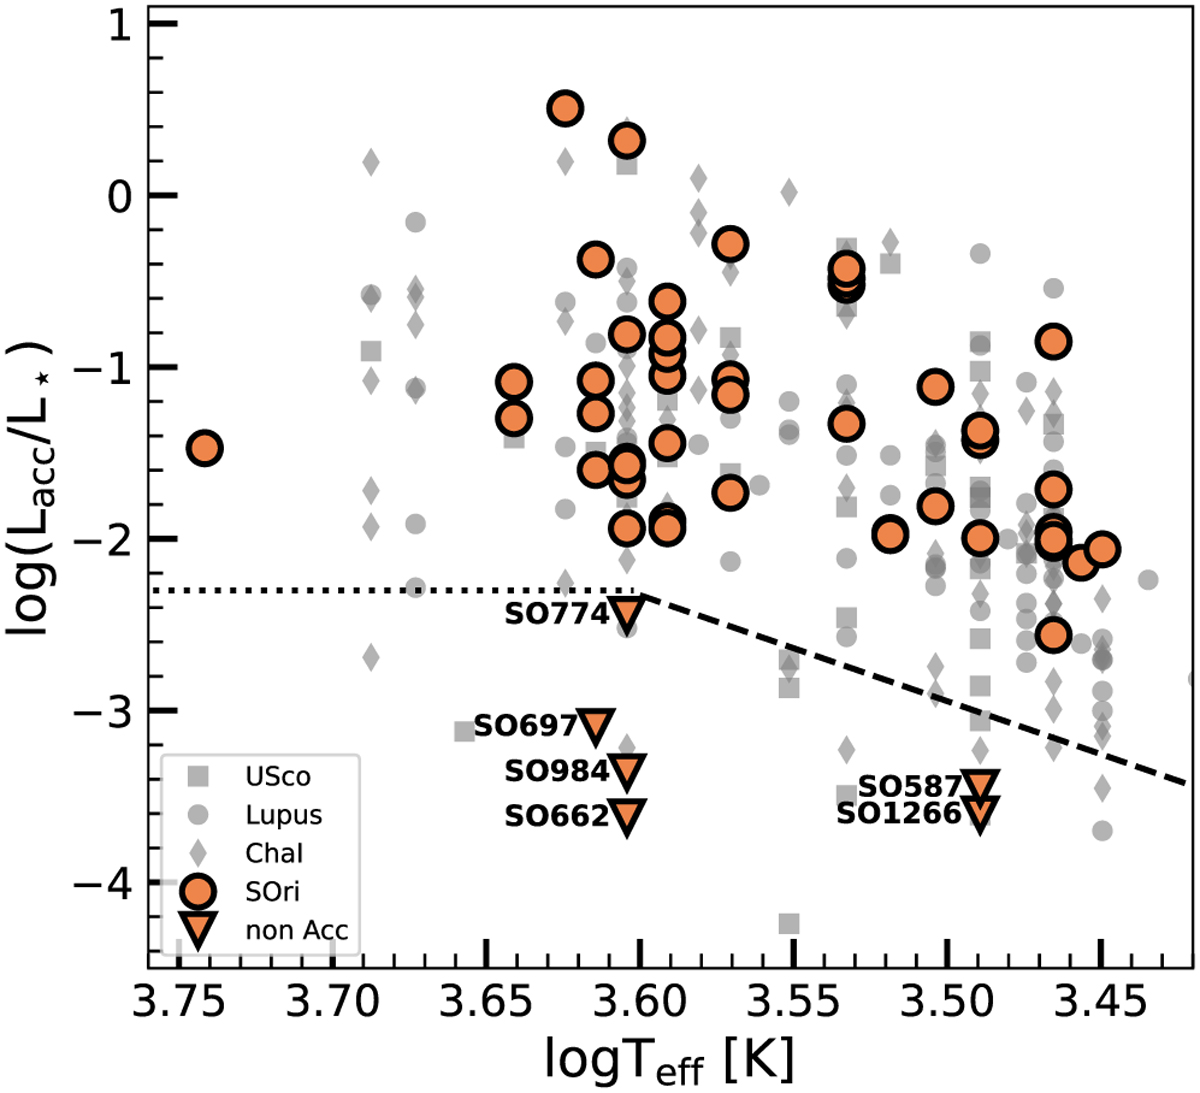
Ratio between the accretion and stellar luminosities vs. effective temperature. σ-Orionis sources are indicated by orange circles while stars in other young SFRs by gray symbols. The dotted and dashed lines represent the locus of the chromospheric emission defined by Manara et al. (2013b, 2017a). Downward triangles indicate the non-accretors identified in this work.
Current usage metrics show cumulative count of Article Views (full-text article views including HTML views, PDF and ePub downloads, according to the available data) and Abstracts Views on Vision4Press platform.
Data correspond to usage on the plateform after 2015. The current usage metrics is available 48-96 hours after online publication and is updated daily on week days.
Initial download of the metrics may take a while.