| Issue |
A&A
Volume 680, December 2023
|
|
|---|---|---|
| Article Number | C1 | |
| Number of page(s) | 1 | |
| Section | Interstellar and circumstellar matter | |
| DOI | https://doi.org/10.1051/0004-6361/202348748e | |
| Published online | 15 December 2023 | |
Testing external photoevaporation in the σ-Orionis cluster with spectroscopy and disk mass measurements★ (Corrigendum)
1
European Southern Observatory,
Karl-Schwarzschild-Strasse 2,
85748
Garching bei München, Germany
e-mail: kmaucoco@eso.org
2
NASA Headquarters,
300 E Street SW,
Washington, DC
20546, USA
3
Dipartimento di Fisica, Universitá degli Studi di Milano,
Via Giovanni Celoria 16,
20133
Milano, Italy
4
Max-Planck Institute for Extraterrestrial Physics,
Gießenbachstraße 1,
85748
Garching, Germany
5
INAF – Osservatorio Astronomico di Capodimonte,
via Moiariello 16,
80131
Napoli, Italy
6
Astronomy Unit, School of Physics and Astronomy, Queen Mary University of London,
G O Jones Building, 327 Mile End Rd, Bethnal Green,
London
E1 4NS, UK
7
Institute for Astronomy, University of Hawai’i at Mānoa,
2680 Woodlawn Dr,
Honolulu, HI
96822, USA
Key words: protoplanetary disks / accretion, accretion disks / stars: pre-main sequence / stars: variables: T Tauri, Herbig Ae/Be / errata, addenda
A technical error occurred during the production of the published article: in Figs. 6 and 7, the orange circles (describing the σ-Orionis sources) disappeared. The corrected figures are presented here.
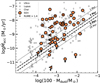 |
Fig. 6 Distribution of the Ṁacc–Ṁdisk in σ-Orionis. The triangles indicate the upper limit on Mdisk while the vertical arrows correspond to the upper limits on the Ṁacc. The dotted and dashed lines are the isochrones at some relevant ages. The ones in bold are related to the estimated age of the cluster, i.e., 3–5 Myr (Oliveira et al. 2004). Values for other star-forming regions (Manara et al. 2023) are shown as gray symbols for comparison. |
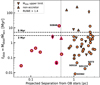 |
Fig. 7 Distribution of tdisk as a function of projected separation from σ-Ori. The downward triangles indicate upper limits on Mdisk while upward triangles indicate upper limits on Ṁacc. The vertical dotted line is located at 0.5 pc from σ-Ori. Targets within 0.5 pc are highlighted with an additional red outline. The dashed lines are related to the estimated age of the cluster, i.e., 3–5 Myr (Oliveira et al. 2004). |
References
- Manara, C. F., Ansdell, M., Rosotti, G. P., et al. 2023, Protostars and Planets VII, eds. S. Inutsuka, Y. Aikawa, T. Muto, K. Tomida, & M. Tamura, Astronomical Society of the Pacific Conference Series, 534, 539 [NASA ADS] [Google Scholar]
- Oliveira, J. M., Jeffries, R. D., & van Loon, J. T. 2004, MNRAS, 347, 1327 [NASA ADS] [CrossRef] [Google Scholar]
© The Authors 2023
 Open Access article, published by EDP Sciences, under the terms of the Creative Commons Attribution License (https://creativecommons.org/licenses/by/4.0), which permits unrestricted use, distribution, and reproduction in any medium, provided the original work is properly cited.
This article is published in open access under the Subscribe to Open model. Subscribe to A&A to support open access publication.
All Figures
|
Fig. 6 Distribution of the Ṁacc–Ṁdisk in σ-Orionis. The triangles indicate the upper limit on Mdisk while the vertical arrows correspond to the upper limits on the Ṁacc. The dotted and dashed lines are the isochrones at some relevant ages. The ones in bold are related to the estimated age of the cluster, i.e., 3–5 Myr (Oliveira et al. 2004). Values for other star-forming regions (Manara et al. 2023) are shown as gray symbols for comparison. |
| In the text | |
|
Fig. 7 Distribution of tdisk as a function of projected separation from σ-Ori. The downward triangles indicate upper limits on Mdisk while upward triangles indicate upper limits on Ṁacc. The vertical dotted line is located at 0.5 pc from σ-Ori. Targets within 0.5 pc are highlighted with an additional red outline. The dashed lines are related to the estimated age of the cluster, i.e., 3–5 Myr (Oliveira et al. 2004). |
| In the text | |
Current usage metrics show cumulative count of Article Views (full-text article views including HTML views, PDF and ePub downloads, according to the available data) and Abstracts Views on Vision4Press platform.
Data correspond to usage on the plateform after 2015. The current usage metrics is available 48-96 hours after online publication and is updated daily on week days.
Initial download of the metrics may take a while.