Fig. 7
Download original image
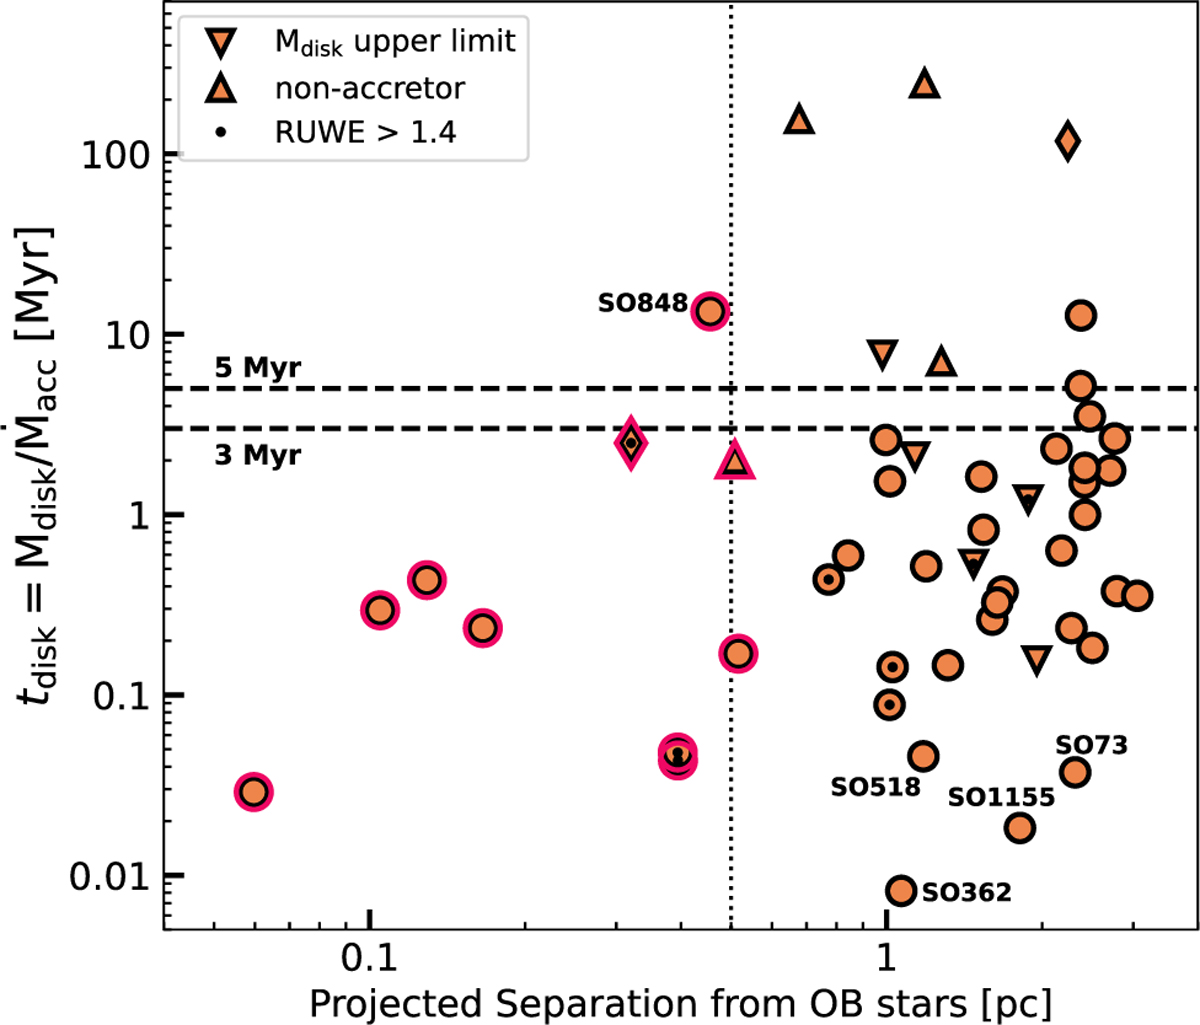
Distribution of tdisk as a function of projected separation from σ-Ori. The downward triangles indicate upper limits on Mdisk while upward triangles indicate upper limits on Ṁacc. The vertical dotted line is located at 0.5 pc from σ-Ori. Targets within 0.5 pc are highlighted with an additional red outline. The dashed lines are related to the estimated age of the cluster, i.e., 3–5 Myr (Oliveira et al. 2004).
Current usage metrics show cumulative count of Article Views (full-text article views including HTML views, PDF and ePub downloads, according to the available data) and Abstracts Views on Vision4Press platform.
Data correspond to usage on the plateform after 2015. The current usage metrics is available 48-96 hours after online publication and is updated daily on week days.
Initial download of the metrics may take a while.