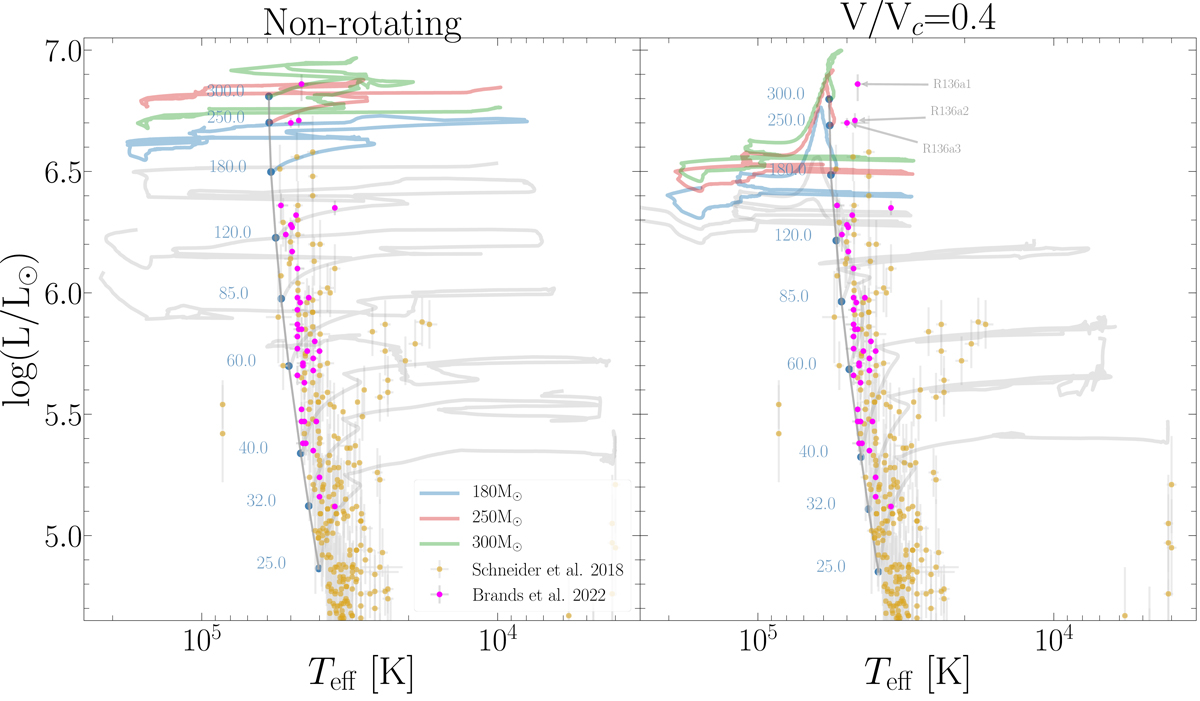
Fig. 9.
Download original image
HRD of the Tarantula Nebula from the compilation of Schneider et al. (2018; regrouping results from Ramírez-Agudelo et al. 2017; Sabín-Sanjulián et al. 2014, 2017; McEvoy et al. 2015; Bestenlehner et al. 2014) and the R136 cluster members from the work of Brands et al. (2022). The GENEC tracks are overplotted in gray, with color emphasis on the VMS models computed here, and the ZAMS is drawn in dark gray. The HRD is plotted for nonrotating (left) and rotating (at V/Vc = 0.4; right) models. Their effective temperatures are not corrected for the optical thickness of the wind. The three most massive components of the cluster (R136a1/2/3) are pinpointed by arrows in the right panel.
Current usage metrics show cumulative count of Article Views (full-text article views including HTML views, PDF and ePub downloads, according to the available data) and Abstracts Views on Vision4Press platform.
Data correspond to usage on the plateform after 2015. The current usage metrics is available 48-96 hours after online publication and is updated daily on week days.
Initial download of the metrics may take a while.