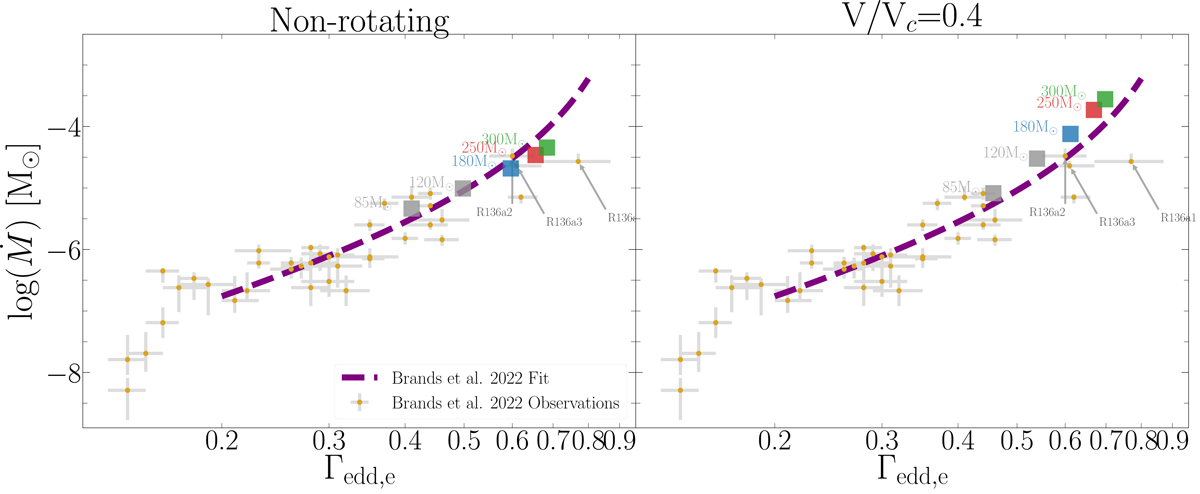
Fig. 8.
Download original image
Time-averaged mass-loss rates over the main sequence as a function of the Eddington parameter Γedd, e. The models of 85–120 M⊙ are from Eggenberger et al. (2021), and the models of 180–300 M⊙ are from this work. The observations of Brands et al. (2022) of the R136 components are displayed in gold. The fit they obtained is displayed in purple. The three most massive components of the cluster (R136a1/2/3) are pinpointed by arrows.
Current usage metrics show cumulative count of Article Views (full-text article views including HTML views, PDF and ePub downloads, according to the available data) and Abstracts Views on Vision4Press platform.
Data correspond to usage on the plateform after 2015. The current usage metrics is available 48-96 hours after online publication and is updated daily on week days.
Initial download of the metrics may take a while.