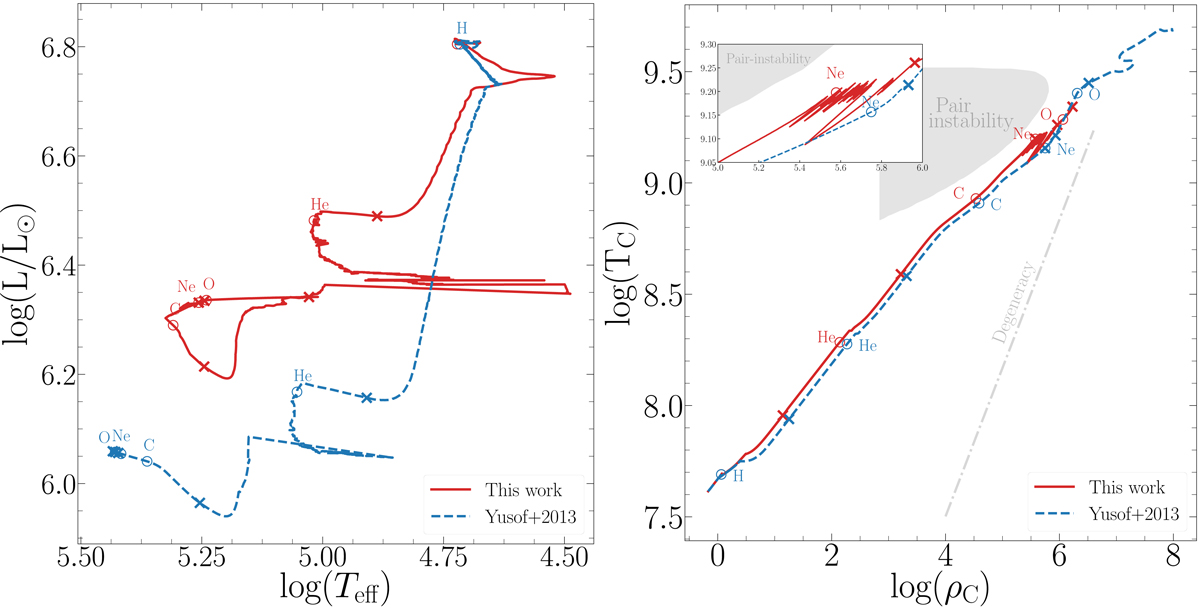
Fig. 7.
Download original image
Comparison with previous models. Left: HRD of a rotating 300 M⊙ at Z = 0.014 from the work of Yusof et al. (2013) and from this work. The beginning of each burning phase (defined as the moment when the central abundance of the element concerned decreases by 1%) and the end of it (defined as the moment when the central abundance is lower than 10−5) are displayed as open circles and crosses, respectively. Right: central temperature as a function of the central density for the same models. A zoom can be seen in the upper left displaying the region where the model starts undergoing pair-creation inside the core, leading the model with the new EOS – which takes this effect into account – to contract and expand rapidly as the pair-creation reduces the radiative pressure.
Current usage metrics show cumulative count of Article Views (full-text article views including HTML views, PDF and ePub downloads, according to the available data) and Abstracts Views on Vision4Press platform.
Data correspond to usage on the plateform after 2015. The current usage metrics is available 48-96 hours after online publication and is updated daily on week days.
Initial download of the metrics may take a while.