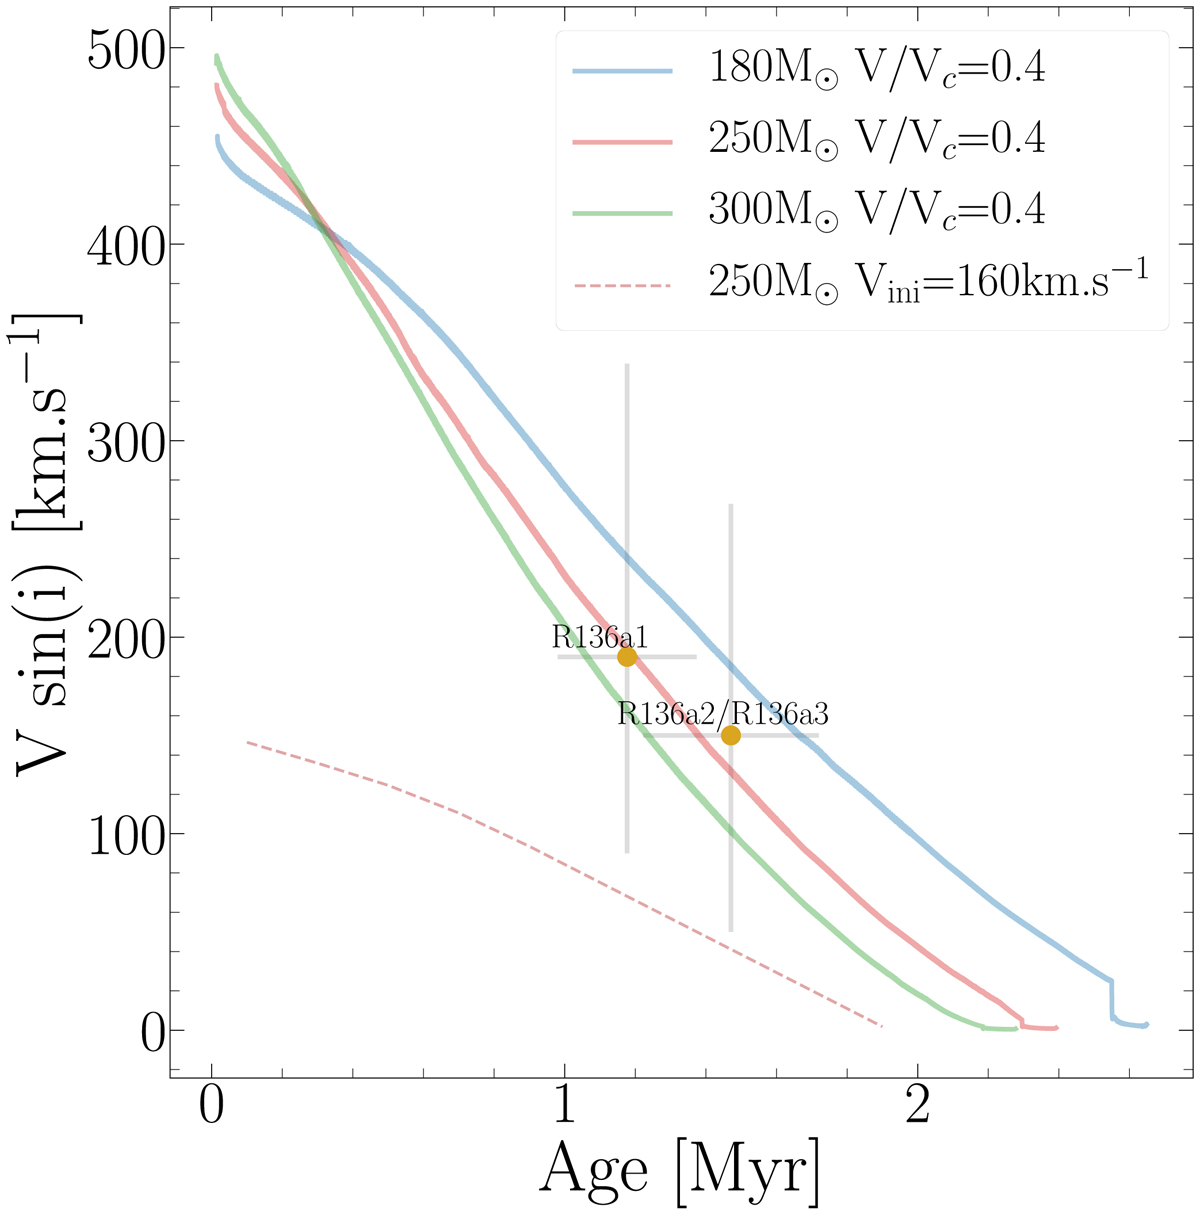
Fig. 10.
Download original image
Evolution of the surface velocity of VMS models. An additional model with slower initial rotation rate has been computed for this plot. The observed velocities of the three most massive components of R136 are overplotted (R136a2 and R136a3 have similar velocities obtained). The uncertainties on the velocity are taken from the maximum macro-turbulent velocity observed for stars close to the Eddington limit (Simón-Díaz et al. 2017) for the lower limit, and from the maximum velocities obtained from the angle-of-view effect for the upper limit.
Current usage metrics show cumulative count of Article Views (full-text article views including HTML views, PDF and ePub downloads, according to the available data) and Abstracts Views on Vision4Press platform.
Data correspond to usage on the plateform after 2015. The current usage metrics is available 48-96 hours after online publication and is updated daily on week days.
Initial download of the metrics may take a while.