Fig. A.2
Download original image
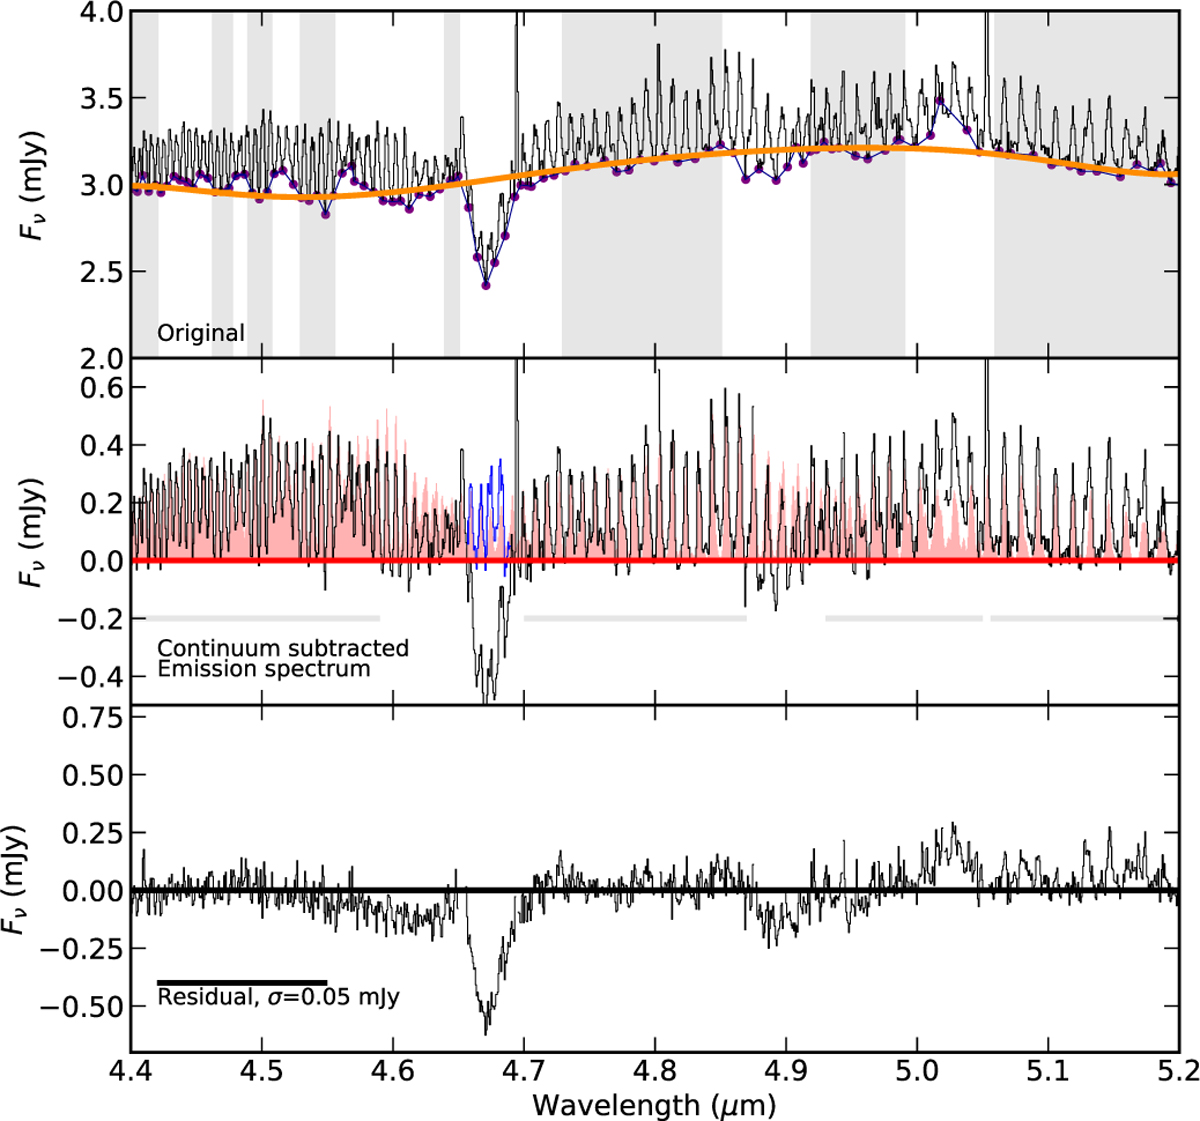
Overview of the CO gas line fitting procedure following the steps described in the text. Top panel: observed source integrated spectrum of HH 48 NE with selected troughs in between the emission lines in purple. Regions used to fit the continuum underneath the lines are marked in gray. Middle panel: continuum subtracted CO emission spectrum, corrected for the optical depth in the CO ice feature (blue region). The best fitting model is shown in red, regions taken into account in the fitting are marked with a gray horizontal line. Bottom panel: residual spectrum of subtracting the model from the data. The standard deviation over this region is 0.05 mJy, compared to 0.27 mJy in the CO line-free continuum at ~4 µm (see Fig. 2).
Current usage metrics show cumulative count of Article Views (full-text article views including HTML views, PDF and ePub downloads, according to the available data) and Abstracts Views on Vision4Press platform.
Data correspond to usage on the plateform after 2015. The current usage metrics is available 48-96 hours after online publication and is updated daily on week days.
Initial download of the metrics may take a while.