Fig. A.1
Download original image
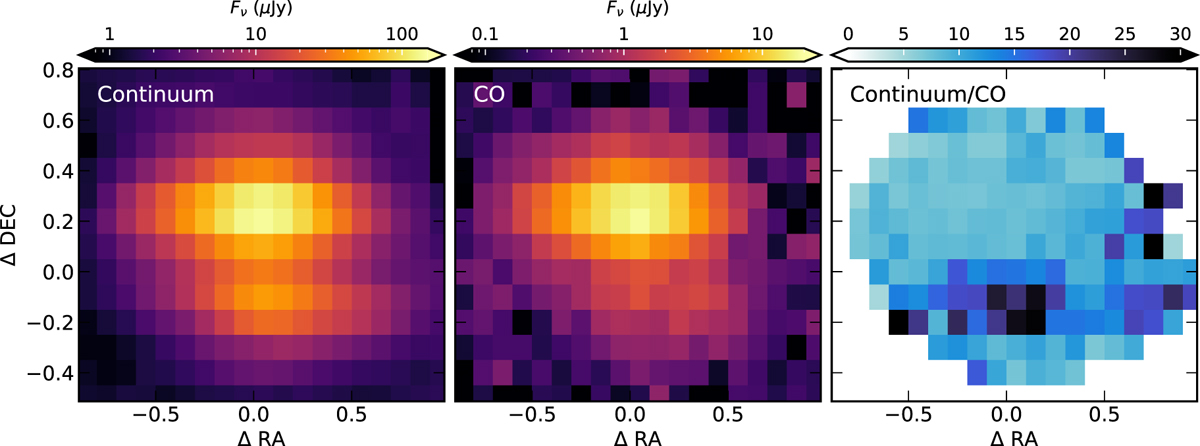
Comparison between the spatial distribution of the CO emission and the continuum emission. Left: spatial distribution of the median continuum flux in the region with CO gas emission (4.36–5.2 µm). Middle: spatial distribution of the median of the peak fluxes of the CO gas emission lines. Right: ratio of the left two panels showing a constant ratio in the upper surface, but a higher ratio in the lower surface due to missing CO flux.
Current usage metrics show cumulative count of Article Views (full-text article views including HTML views, PDF and ePub downloads, according to the available data) and Abstracts Views on Vision4Press platform.
Data correspond to usage on the plateform after 2015. The current usage metrics is available 48-96 hours after online publication and is updated daily on week days.
Initial download of the metrics may take a while.