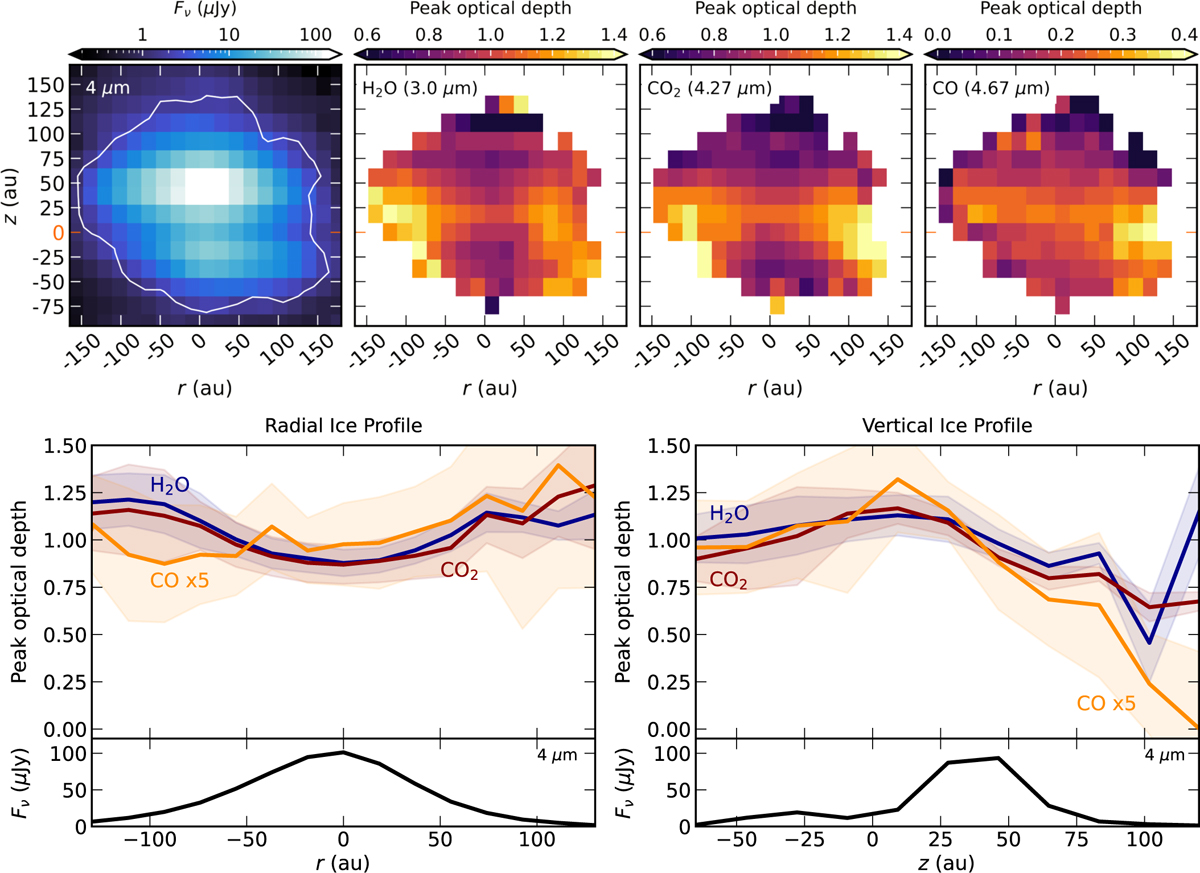
Fig. 4
Download original image
Overview of the variations in the relative strength of the three strongest ice features, H2O, CO2, and CO. Top left panel: continuum flux of HH 48 NE at 4 µm on a logarithmic scale. The white line denotes the 5σ detection limit on the continuum, determined in a featureless part of the spectrum, namely the 3.85–4 µm region. This field of view is the same as the dashed rectangle in Fig. 1. Other panels in the top row: peak optical depth per spaxel of H2O, CO2, and CO ice, respectively, determined using a Gaussian fit to the optical depth spectrum of each spaxel. Bottom left panel: median combined radial profile of the peak optical depth with the 1σ spread around this line at different disk heights as a shaded region. The black line underneath shows the radial profile of the continuum at 4 µm at z = 50 au. Bottom right panel: median combined vertical profile of the peak optical depth with 1σ spread around this line at different disk radii as a shaded region. The black line underneath shows the vertical profile of the continuum at 4 µm at r = 0 au. We note that z = 0 is chosen as the dark lane between the upper and lower surface: in this frame, the star is located at z ~10 au due to projection effects.
Current usage metrics show cumulative count of Article Views (full-text article views including HTML views, PDF and ePub downloads, according to the available data) and Abstracts Views on Vision4Press platform.
Data correspond to usage on the plateform after 2015. The current usage metrics is available 48-96 hours after online publication and is updated daily on week days.
Initial download of the metrics may take a while.