Fig. 3
Download original image
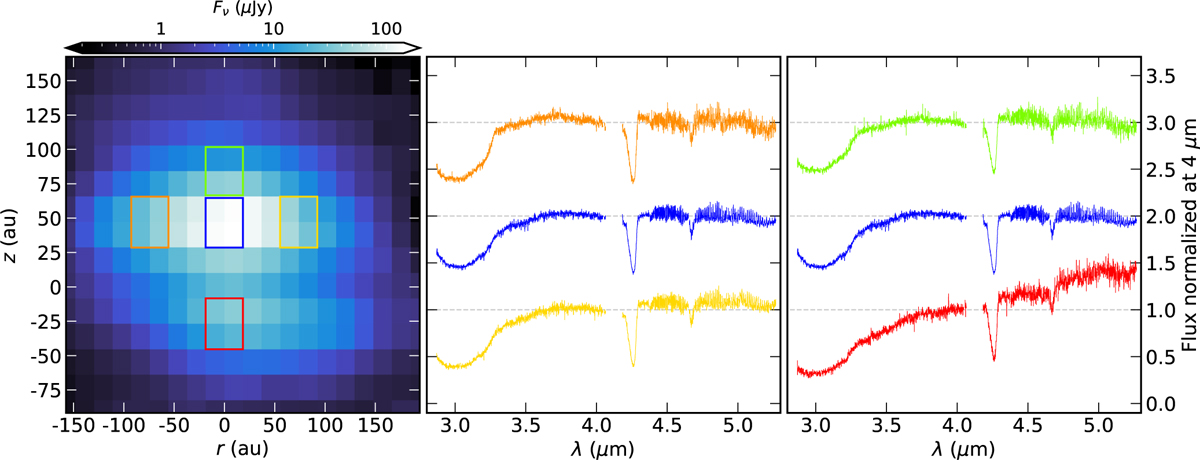
Spatial variations in the spectrum along the major and minor axes of the disk. Left: continuum flux of HH 48 NE at 4 µm on a logarithmic scale. The colored squares mark the regions used to extract the spectra in corresponding colors in the middle and right panel. Middle: three spectra extracted along the major axis of the disk at radial distances of −70, 0 and 70 au with respect to the center. Right: three spectra extracted along the minor axis of the disk at heights of −25, 50 and 80 au with respect to the dark lane.
Current usage metrics show cumulative count of Article Views (full-text article views including HTML views, PDF and ePub downloads, according to the available data) and Abstracts Views on Vision4Press platform.
Data correspond to usage on the plateform after 2015. The current usage metrics is available 48-96 hours after online publication and is updated daily on week days.
Initial download of the metrics may take a while.