Fig. 2
Download original image
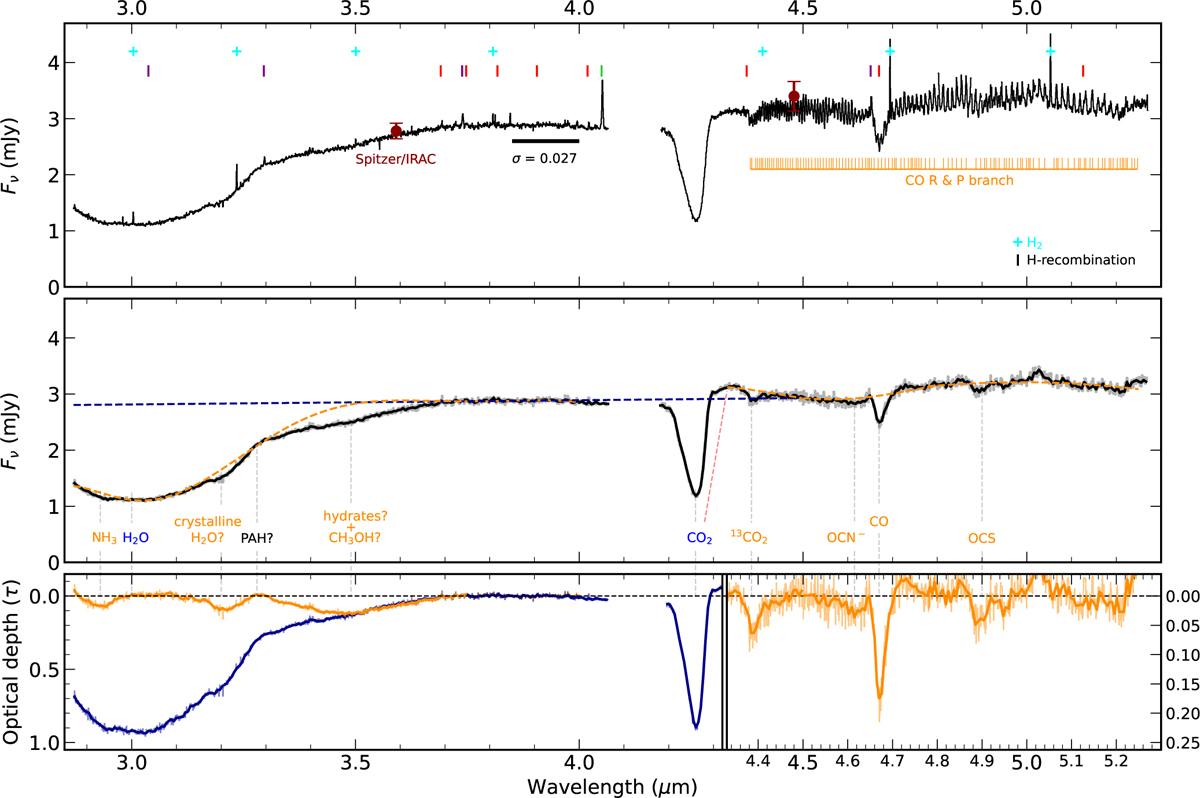
Overview of the disk-integrated JWST/NIRSpec spectrum of HH 48 NE. Top panel: disk-integrated JWST/NIRSpec spectrum with the main gas lines labeled. The molecular hydrogen O and S series lines are marked in cyan. Bracket, Humphreys, and Pfund recombination series of atomic hydrogen are marked in green, red, and purple, respectively. The CO R (4.3–4.7 µm) and P (4.7–5.2 µm) branches of ro-vibrational transitions are marked in orange. The two literature Spitzer/IRAC data points are shown in dark red for comparison. The wavelength range 4.08–4.19 µm is not covered in the used spectral setup. Middle panel: disk-integrated JWST/NIRSpec spectrum with the gas lines removed in black. The procedure for removing the CO lines is described in detail in Appendix A. The positions of the main vibrational modes of the more abundant ice species are labeled, with the continua used to calculate their optical depths shown as dashed lines with corresponding colors. Bottom panel: optical depth of the ice features in the disk-integrated spectrum shown in the middle panel. The two different colors represent optical depths for two different continuum fits, one for the H2O and CO2 features in blue, and one for the weaker ice features neglecting the CO2 and H2O features in orange. Both corresponding continua are shown as a dashed line in the middle panel.
Current usage metrics show cumulative count of Article Views (full-text article views including HTML views, PDF and ePub downloads, according to the available data) and Abstracts Views on Vision4Press platform.
Data correspond to usage on the plateform after 2015. The current usage metrics is available 48-96 hours after online publication and is updated daily on week days.
Initial download of the metrics may take a while.