Fig. 9.
Download original image
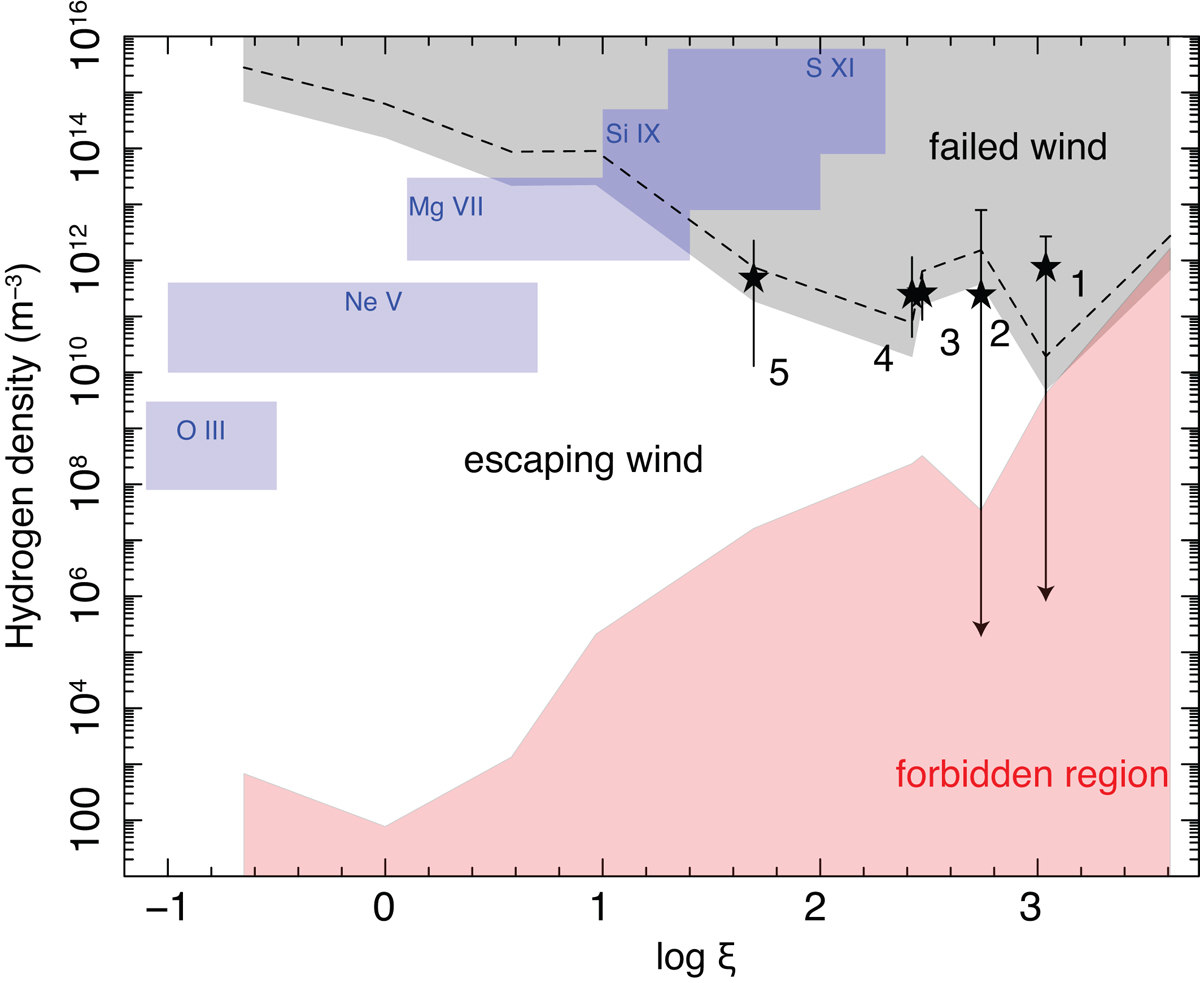
Hydrogen number densities of the warm absorbers plotted as a function of their ionization parameters. Our results for components 1–5 from the tpho model are shown as stars. The gray shaded region represents the region where the outflow is unable to escape the gravitational potential of the black hole due to nH > nesc, while the dashed line indicates the position of ![]() (see Sect. 4.4). The red shaded region shows the forbidden regime where the thickness of the outflow exceeds its distance (nH < nlow). The blue shaded regions indicate the areas where density-sensitive X-ray lines can be utilized to measure densities.
(see Sect. 4.4). The red shaded region shows the forbidden regime where the thickness of the outflow exceeds its distance (nH < nlow). The blue shaded regions indicate the areas where density-sensitive X-ray lines can be utilized to measure densities.
Current usage metrics show cumulative count of Article Views (full-text article views including HTML views, PDF and ePub downloads, according to the available data) and Abstracts Views on Vision4Press platform.
Data correspond to usage on the plateform after 2015. The current usage metrics is available 48-96 hours after online publication and is updated daily on week days.
Initial download of the metrics may take a while.