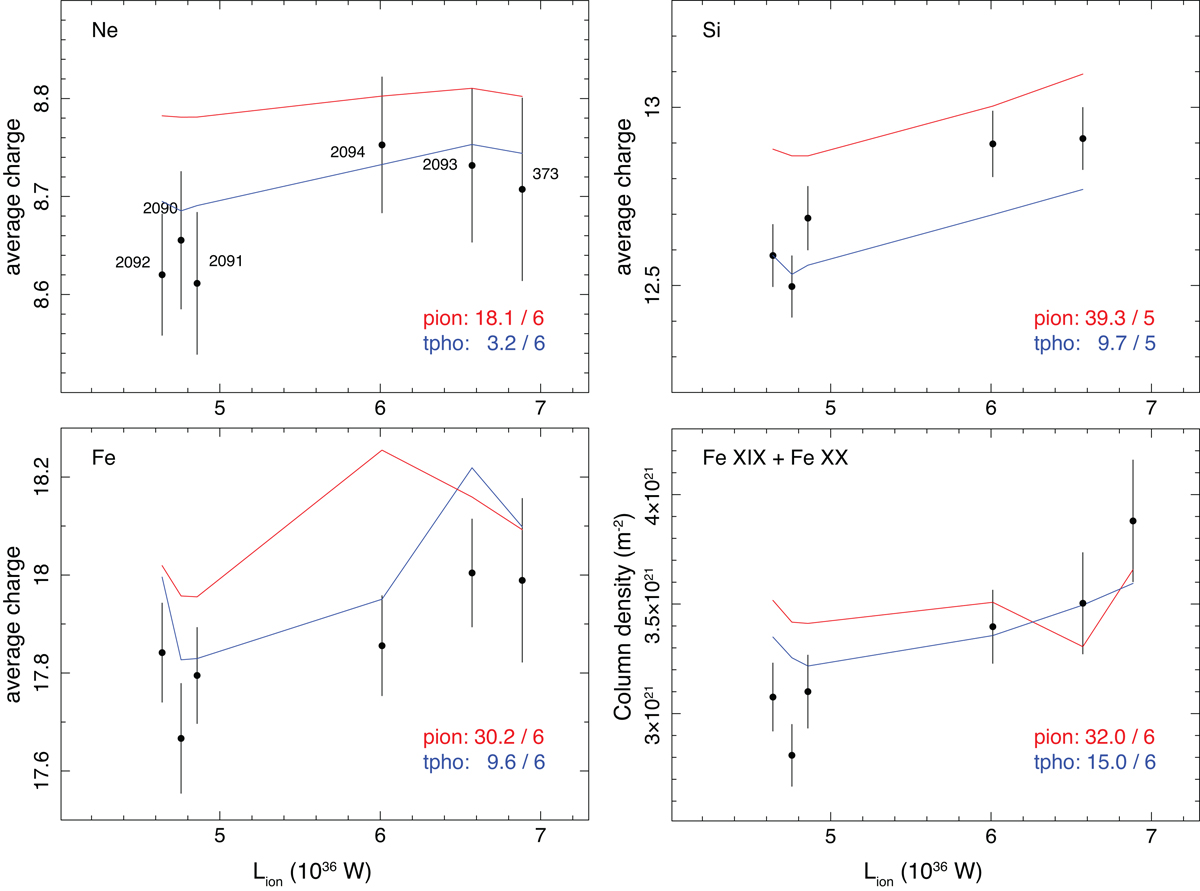
Fig. 8.
Download original image
Average charge states of Ne, Si, and Fe, as well as the combined column densities of Fe XIX and Fe XX, plotted as a function of the ionizing luminosity. The average charges are defined in Sect. 2. Each data point corresponds to an individual observation and was obtained via fitting with the slab model. The values obtained from the pion and tpho models are shown with red and blue curves, respectively. The χ-square values between the models and the data are displayed as numbers in the lower-right corner.
Current usage metrics show cumulative count of Article Views (full-text article views including HTML views, PDF and ePub downloads, according to the available data) and Abstracts Views on Vision4Press platform.
Data correspond to usage on the plateform after 2015. The current usage metrics is available 48-96 hours after online publication and is updated daily on week days.
Initial download of the metrics may take a while.