Open Access
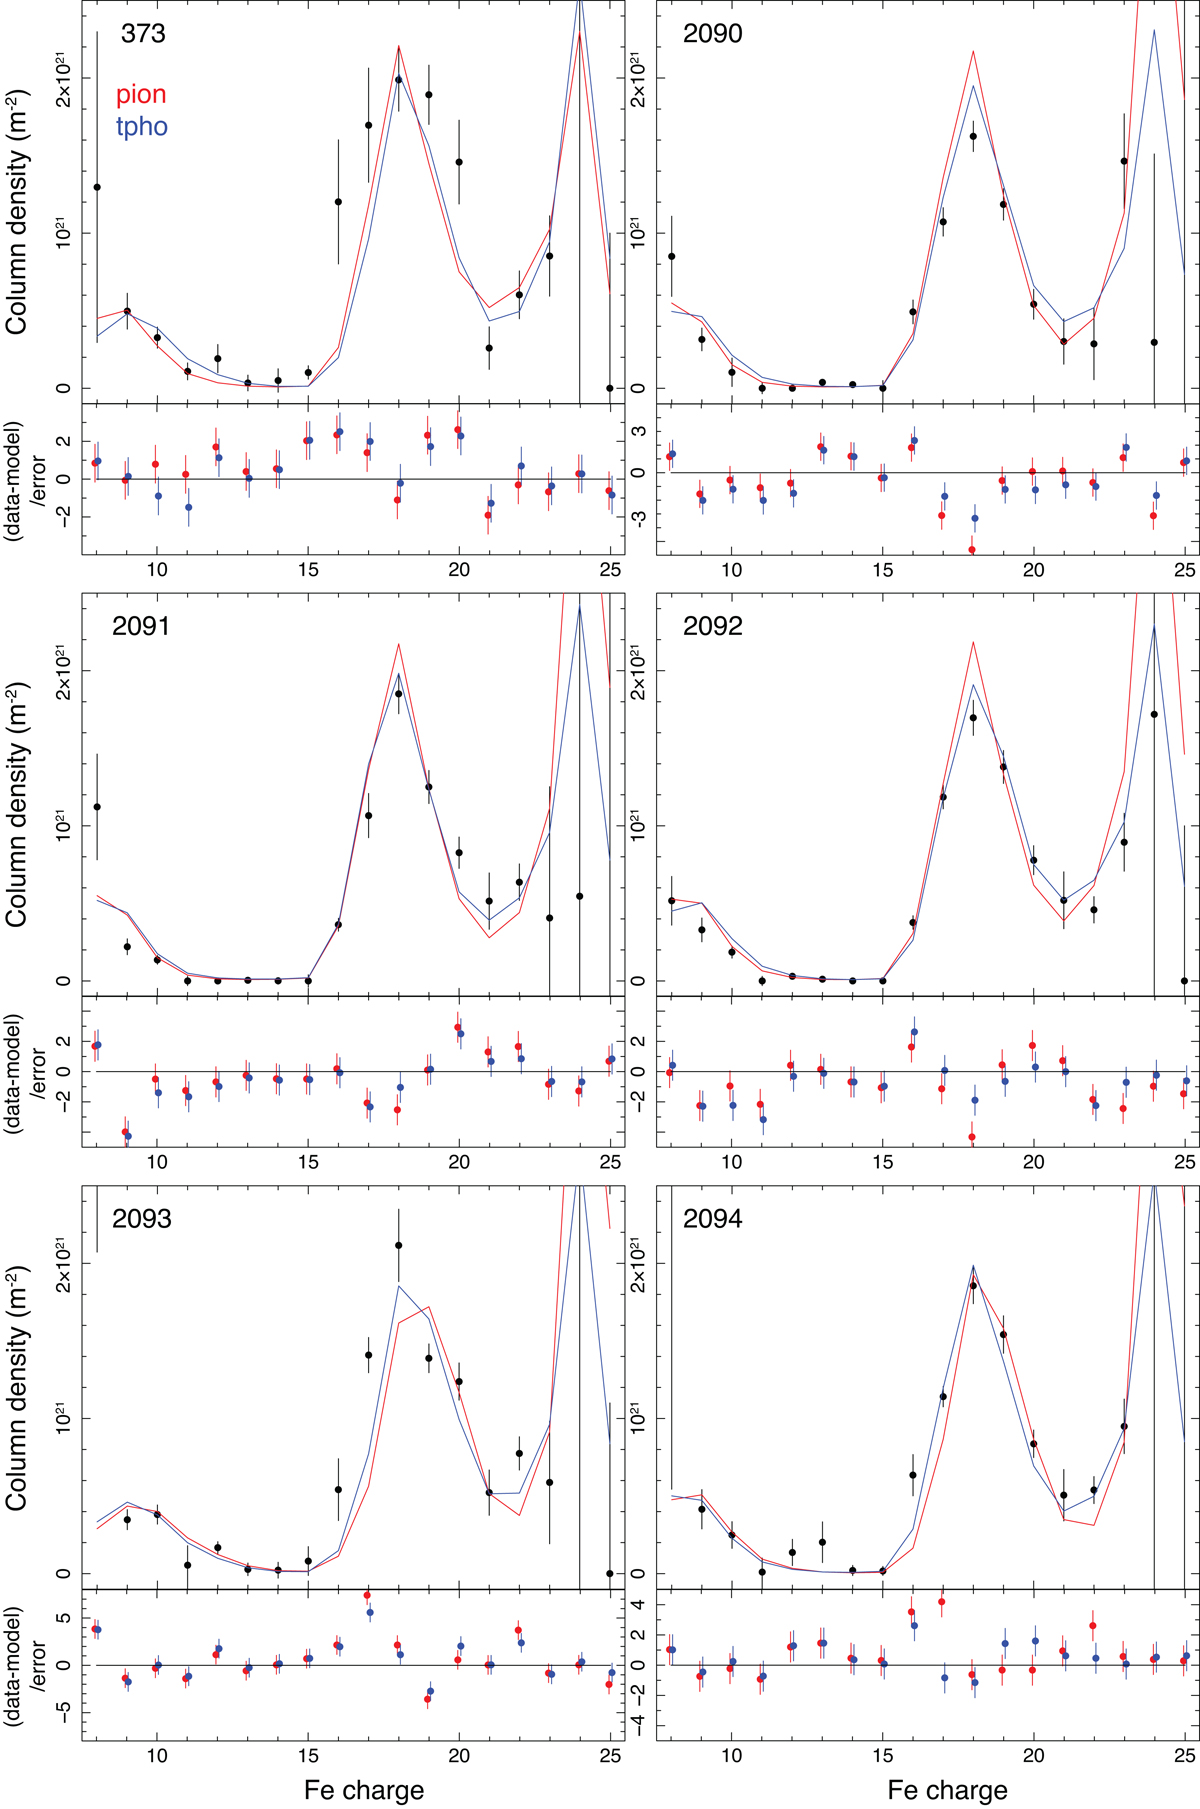
Fig. 7.
Download original image
Column densities of all Fe ions ranging from Fe IX to Fe XXVI determined through fitting using the slab model (black data points). The observed data points are compared with the values computed using the pion (red) and tpho (blue) models. Each panel represents one HETGS observation.
Current usage metrics show cumulative count of Article Views (full-text article views including HTML views, PDF and ePub downloads, according to the available data) and Abstracts Views on Vision4Press platform.
Data correspond to usage on the plateform after 2015. The current usage metrics is available 48-96 hours after online publication and is updated daily on week days.
Initial download of the metrics may take a while.