Open Access
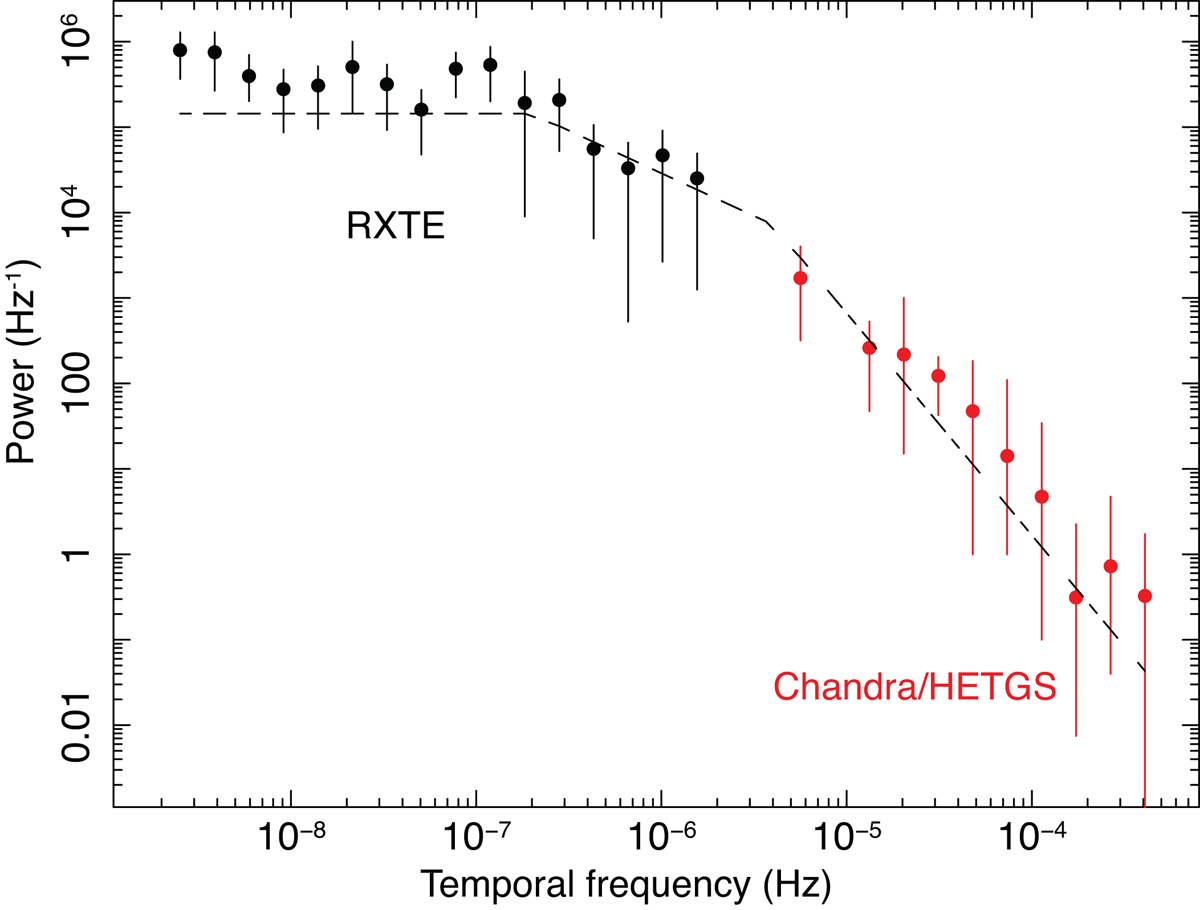
Fig. 6.
Download original image
Power spectral density function of the combined RXTE (black) and Chandra HETGS (red) light curves shown in Fig. 5. The data are compared with the model (dashed line) based on the best-fit results obtained in Markowitz (2005) on the data in the 0.2 − 12.0 keV range.
Current usage metrics show cumulative count of Article Views (full-text article views including HTML views, PDF and ePub downloads, according to the available data) and Abstracts Views on Vision4Press platform.
Data correspond to usage on the plateform after 2015. The current usage metrics is available 48-96 hours after online publication and is updated daily on week days.
Initial download of the metrics may take a while.