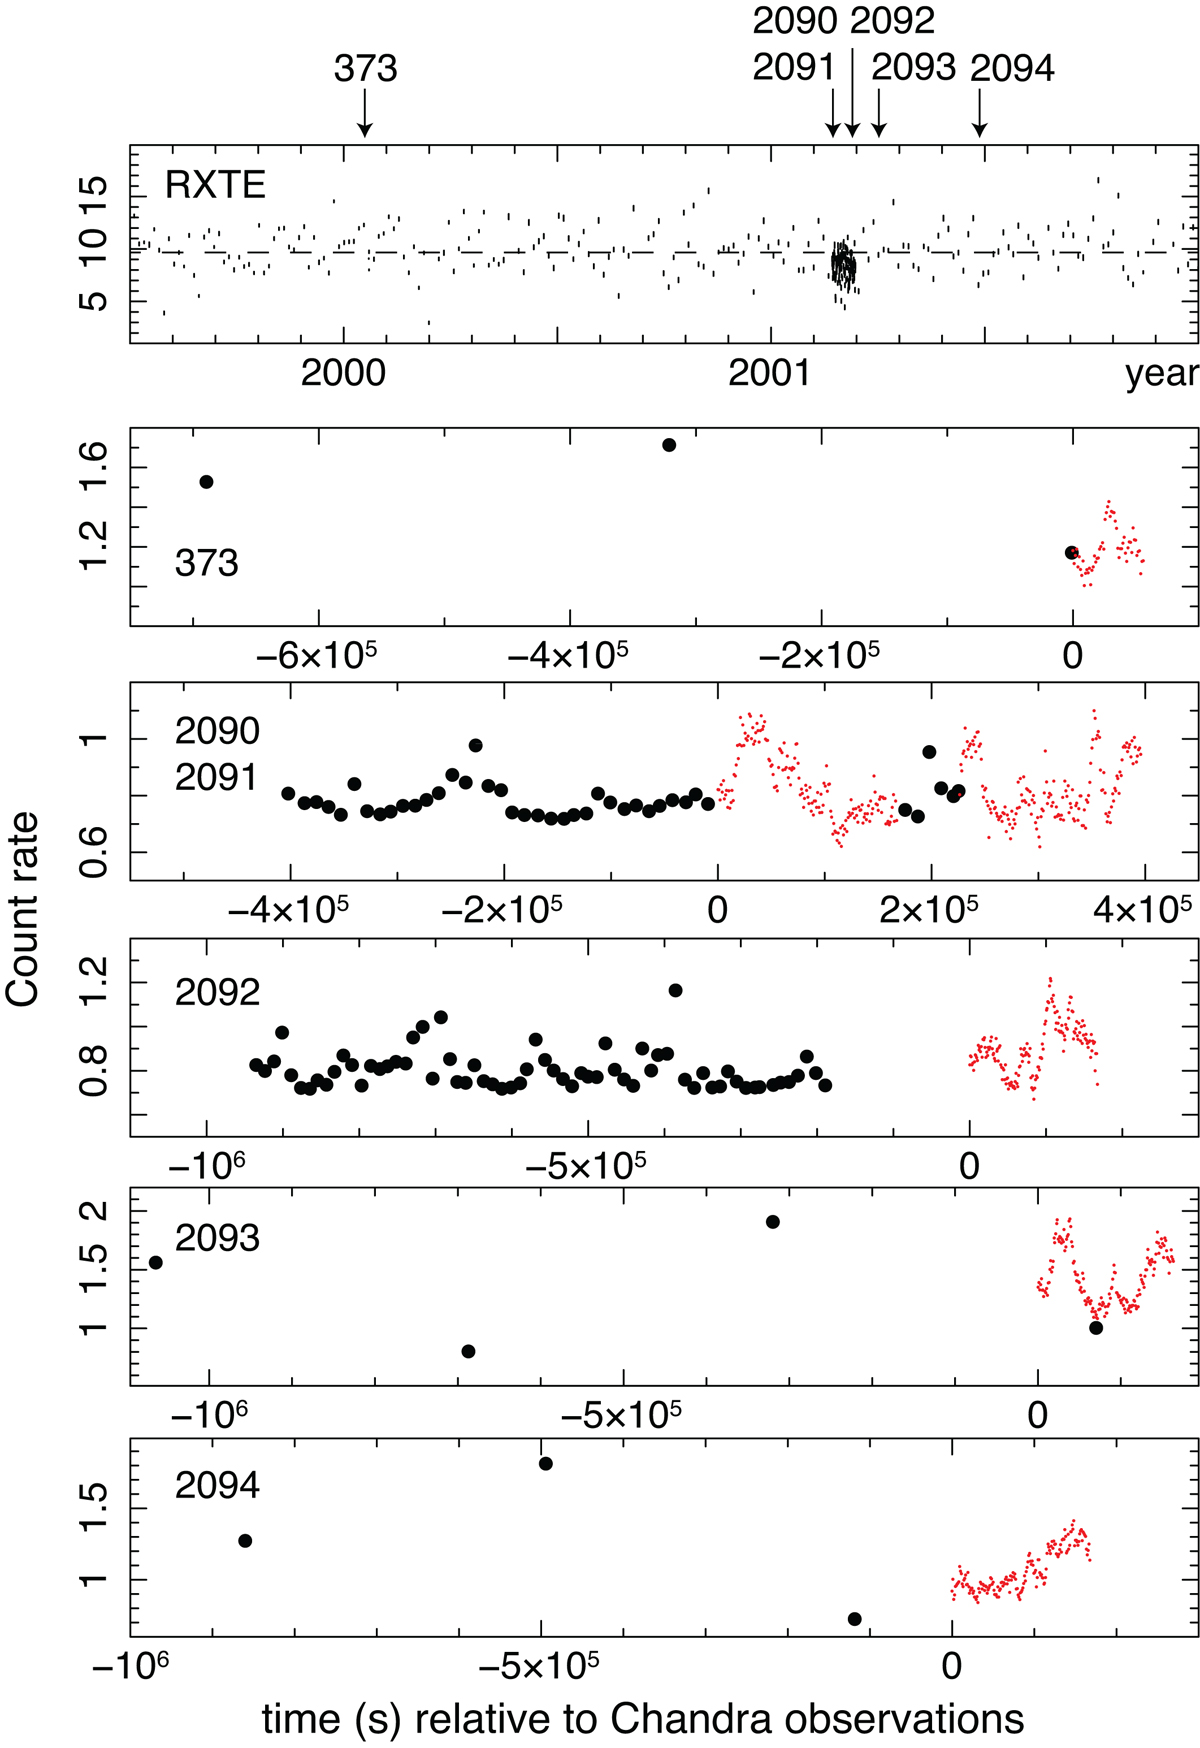
Fig. 5.
Download original image
RXTE and Chandra HETGS light curves of NGC 3783 from mid-1999 to the end of 2001. The upper panel shows the RXTE proportional counter array data in the 2 − 60 keV band, with the average flux level indicated by a horizontal line. The Chandra HETGS light curves are presented in the panels below as red data points, along with the adjacent RXTE data converted using the PIMMS tool.
Current usage metrics show cumulative count of Article Views (full-text article views including HTML views, PDF and ePub downloads, according to the available data) and Abstracts Views on Vision4Press platform.
Data correspond to usage on the plateform after 2015. The current usage metrics is available 48-96 hours after online publication and is updated daily on week days.
Initial download of the metrics may take a while.