Fig. 4.
Download original image
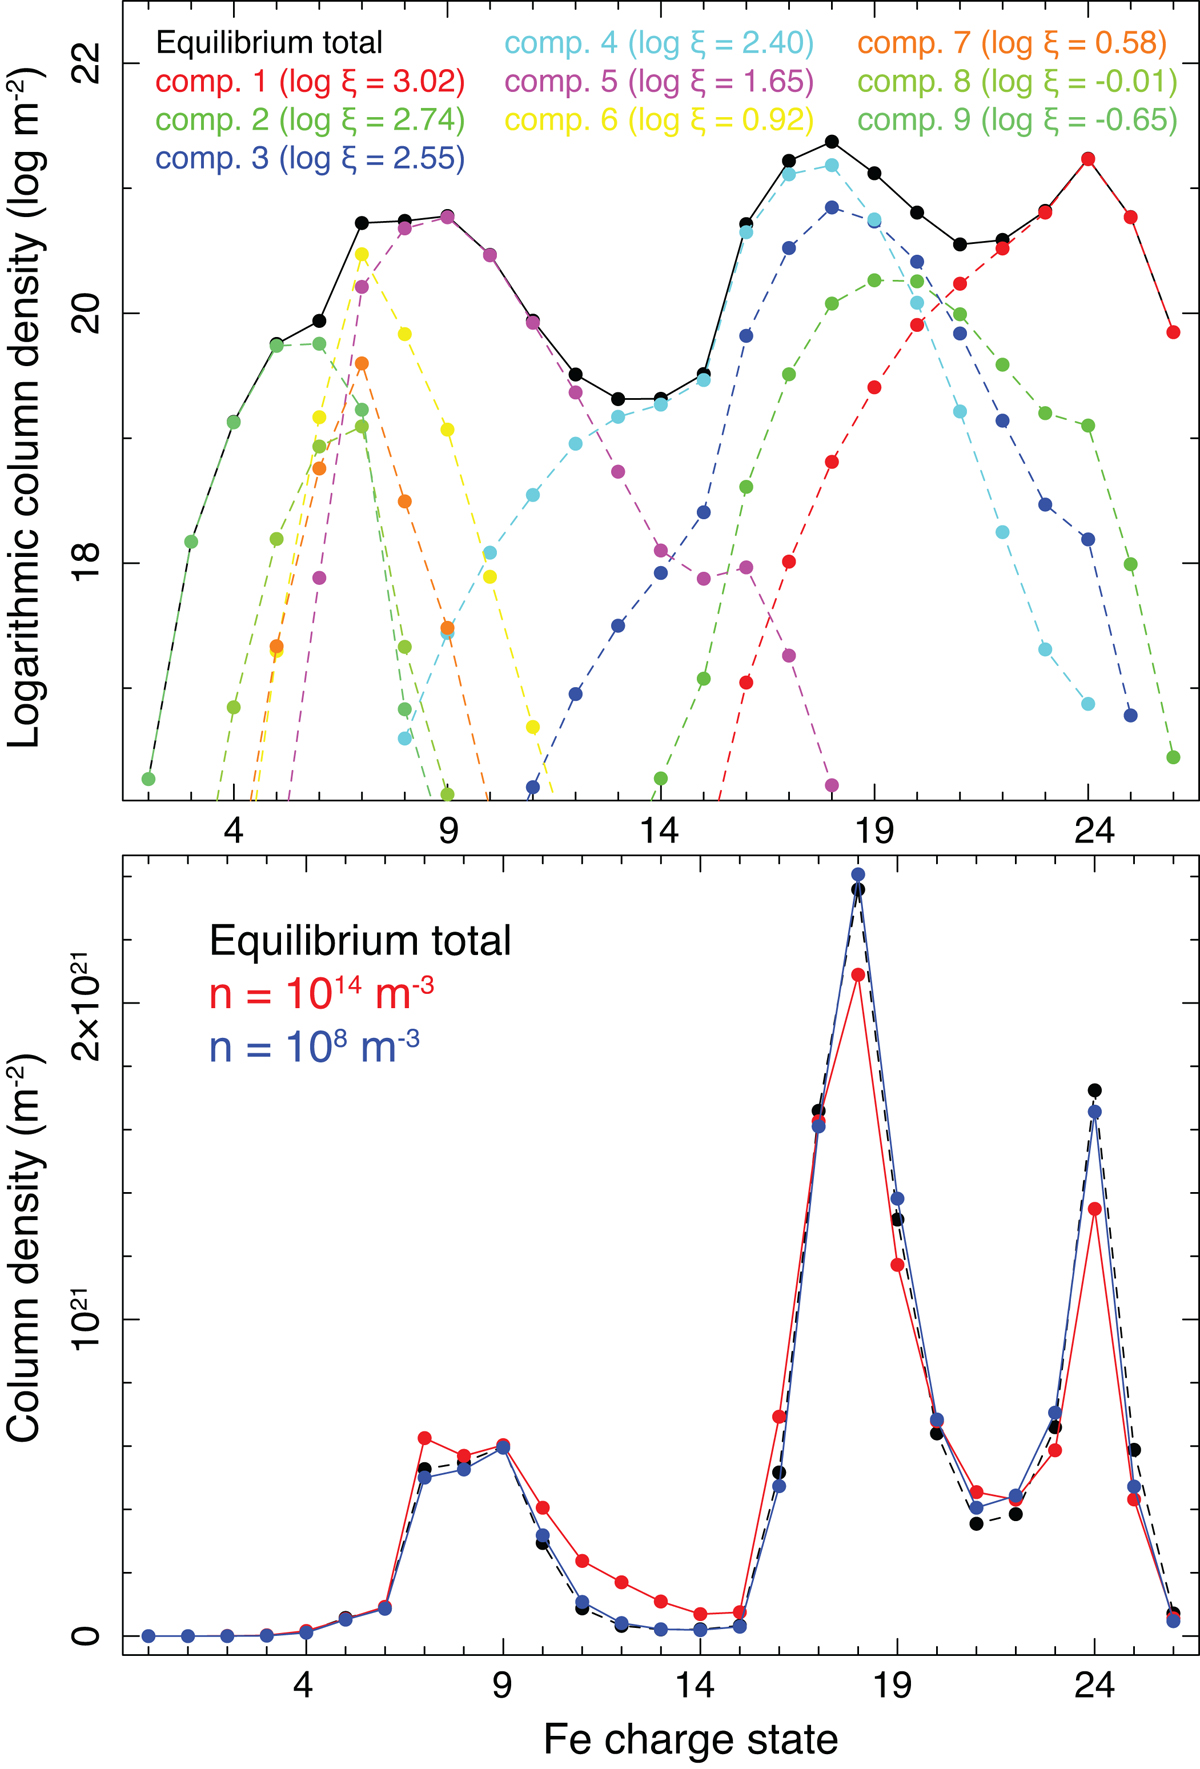
Column densities of Fe in equilibrium and the time-evolving condition. The upper panel shows the total column density of Fe in equilibrium, with each individual component plotted in a different color. To capture the wide range of concentrations, which span several orders of magnitude, a logarithmic scale is employed. The lower panel compares the equilibrium column density (represented as a dashed black line) to the average column density of time-dependent photoionization, with gas densities of 108 and 1014 m−3 shown as blue and red lines.
Current usage metrics show cumulative count of Article Views (full-text article views including HTML views, PDF and ePub downloads, according to the available data) and Abstracts Views on Vision4Press platform.
Data correspond to usage on the plateform after 2015. The current usage metrics is available 48-96 hours after online publication and is updated daily on week days.
Initial download of the metrics may take a while.