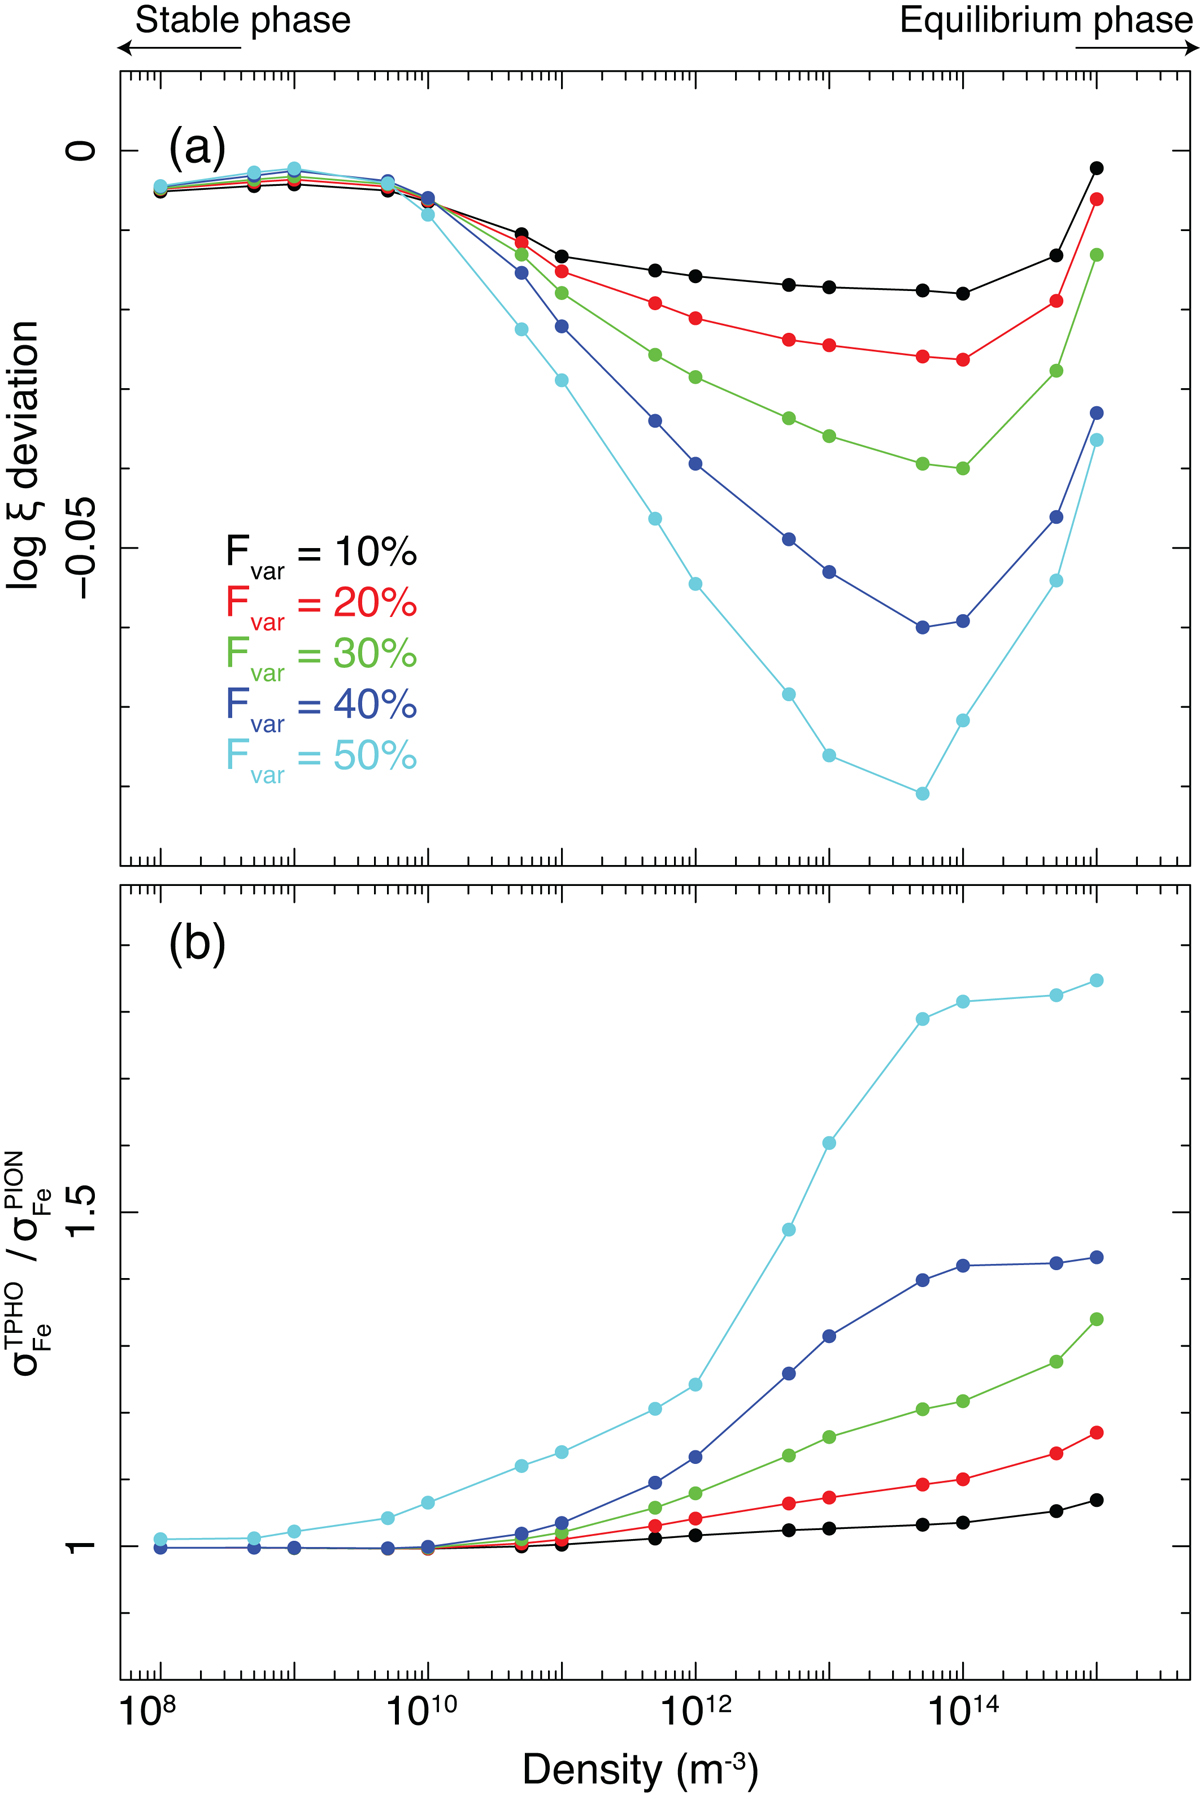
Fig. 3.
Download original image
Deviation of log ξ (a) and the dispersion of the Fe ion concentration (b) plotted as a function of gas densities for light curves with fractional variability ranging from 10% to 50% (the simulated light curve shown in Fig. 1 has an average fractional variability, Fvar, of ∼40%). The deviation of log ξ is calculated as the difference between the intrinsic value and the value obtained from a single equilibrium component fitting of the simulated Fe ion concentration distribution, such as the ones shown in Fig. 2. The curves representing the averages over the nine warm absorber components (see Table 1) are plotted for both the deviation and dispersion.
Current usage metrics show cumulative count of Article Views (full-text article views including HTML views, PDF and ePub downloads, according to the available data) and Abstracts Views on Vision4Press platform.
Data correspond to usage on the plateform after 2015. The current usage metrics is available 48-96 hours after online publication and is updated daily on week days.
Initial download of the metrics may take a while.