Fig. 2.
Download original image
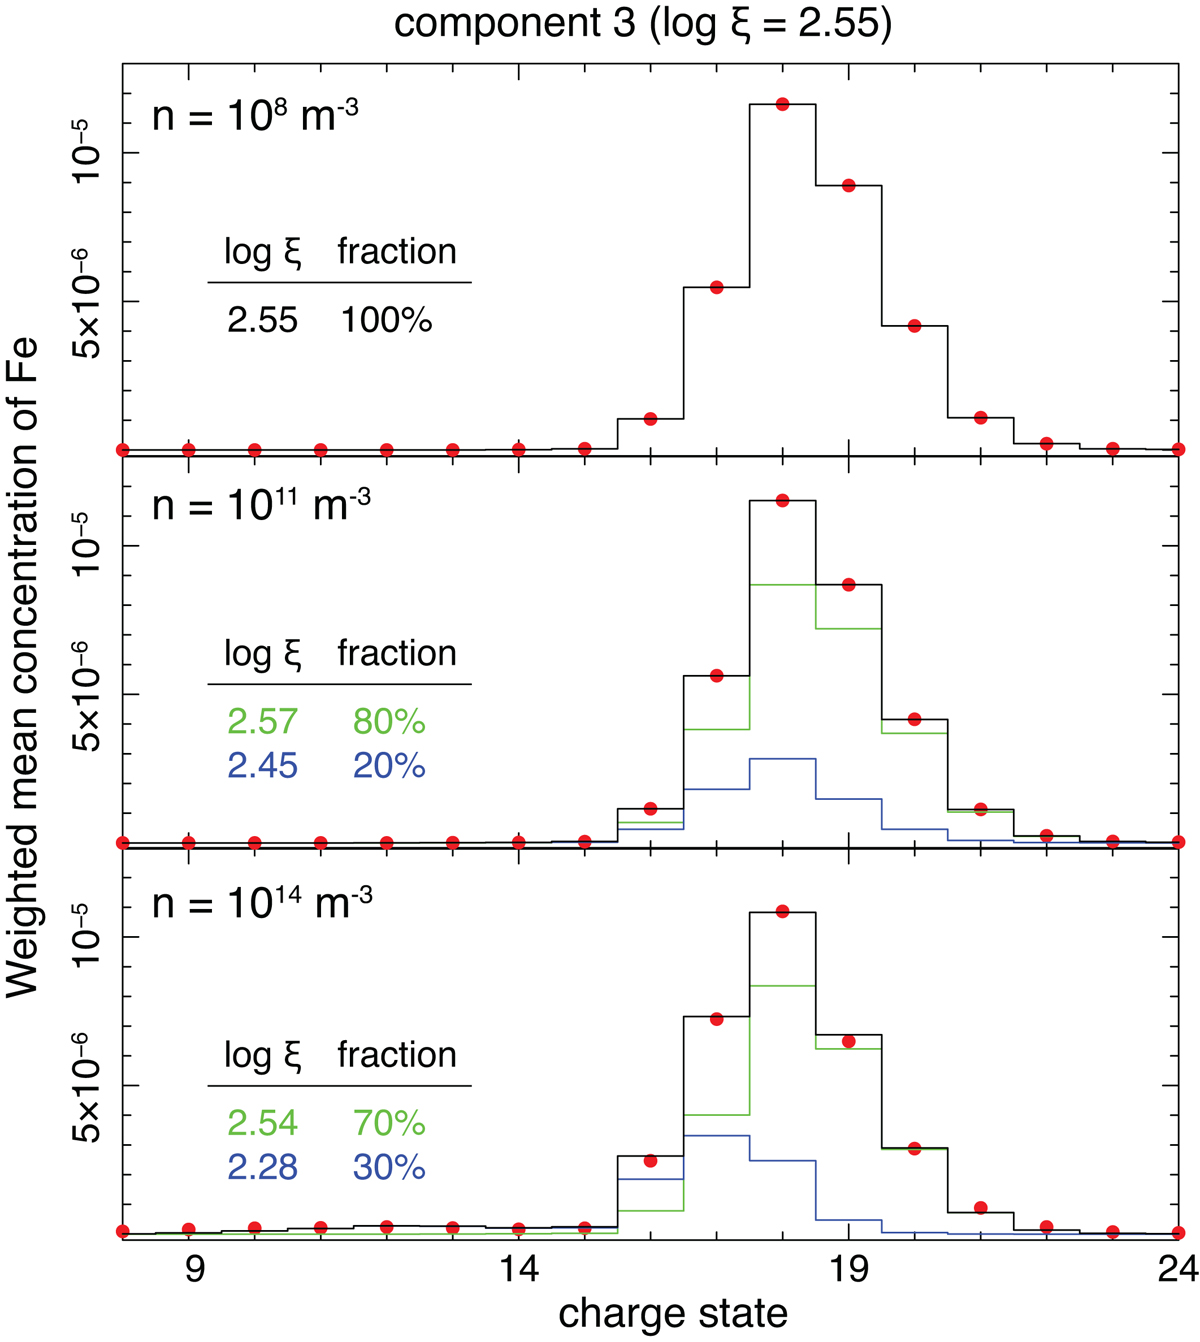
Average concentration distributions of Fe ions obtained from simulation runs with gas densities of 108, 1011, and 1014 m−3 for component 3. The obtained ion concentrations are shown as red dots. The best-fit total concentration, depicted as black lines, is the sum of the two equilibrium components depicted as blue and green lines. The ionization parameters and the fractional contributions of the two equilibrium components are also shown. A single component is sufficient to fit the average concentration in the case of 108 m−3.
Current usage metrics show cumulative count of Article Views (full-text article views including HTML views, PDF and ePub downloads, according to the available data) and Abstracts Views on Vision4Press platform.
Data correspond to usage on the plateform after 2015. The current usage metrics is available 48-96 hours after online publication and is updated daily on week days.
Initial download of the metrics may take a while.