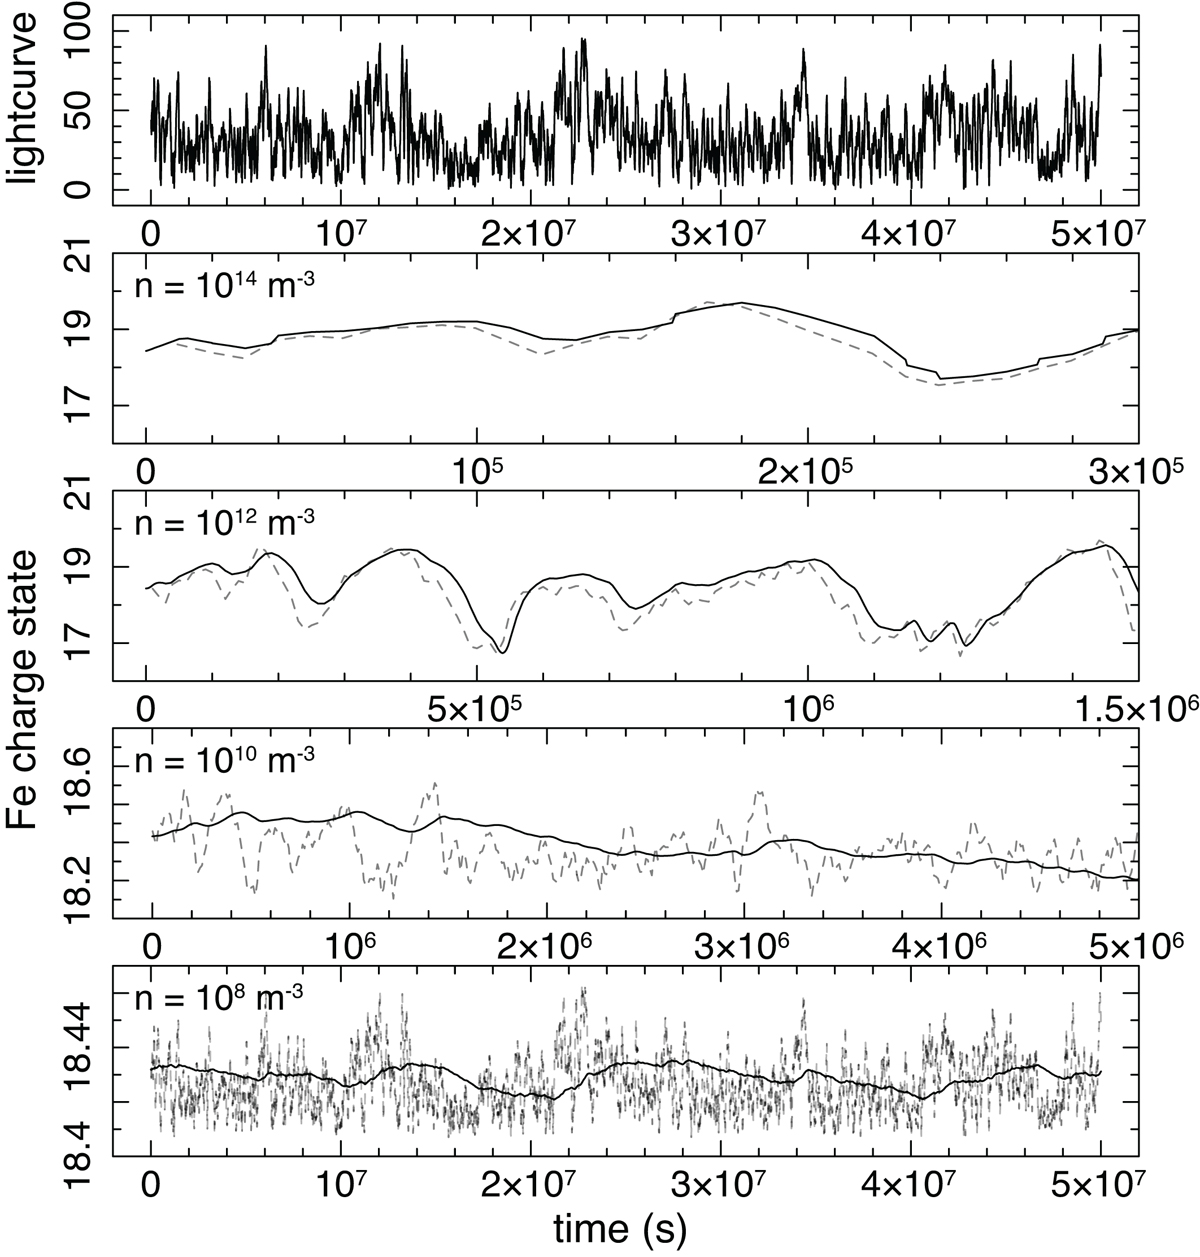
Fig. 1.
Download original image
Simulated light curve (upper panel) and the corresponding evolution of the average Fe charge of component 3 (lower panels). The average charge variations are shown as solid lines for gas densities of 1014, 1012, 1010, and 108 m−3, while the dashed curves illustrate the corresponding source light curves in the same period. As the gas density decreases, the response time to source variations becomes longer, resulting in flatter average charge variations. To highlight the response time differences across various densities, each panel presents a different total time period.
Current usage metrics show cumulative count of Article Views (full-text article views including HTML views, PDF and ePub downloads, according to the available data) and Abstracts Views on Vision4Press platform.
Data correspond to usage on the plateform after 2015. The current usage metrics is available 48-96 hours after online publication and is updated daily on week days.
Initial download of the metrics may take a while.