Fig. 2.
Download original image
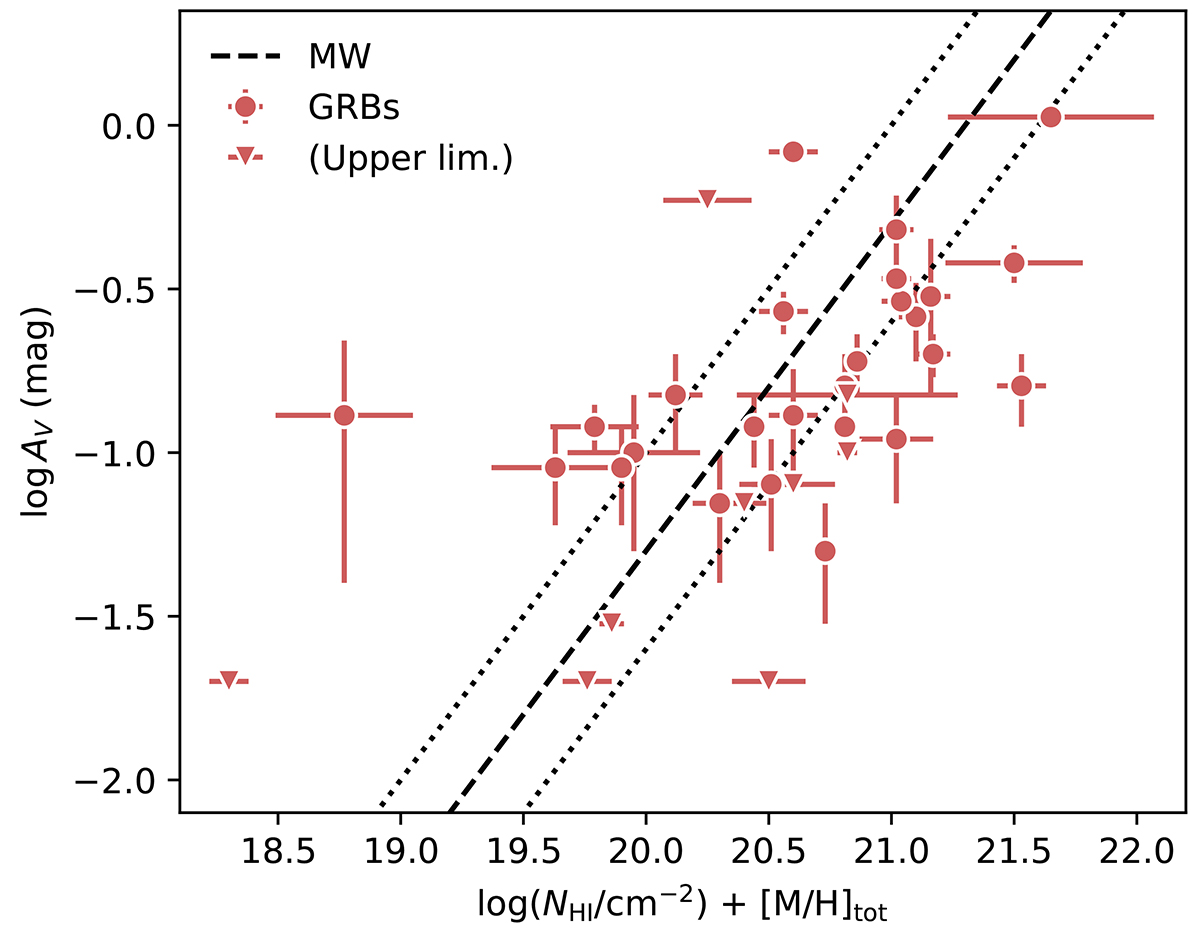
AV vs. the equivalent metal column density, log NHI + [M/H]tot, i.e., the DTM ratio. The red symbols show the GRB sample; the triangles denote 1σ upper limits. The dashed and dotted lines represent the average MW ratio and the scatter (Watson 2011). GRB sightlines probe a large range in DTM ratios, with an average around the Galactic mean value.
Current usage metrics show cumulative count of Article Views (full-text article views including HTML views, PDF and ePub downloads, according to the available data) and Abstracts Views on Vision4Press platform.
Data correspond to usage on the plateform after 2015. The current usage metrics is available 48-96 hours after online publication and is updated daily on week days.
Initial download of the metrics may take a while.