Fig. 7
Download original image
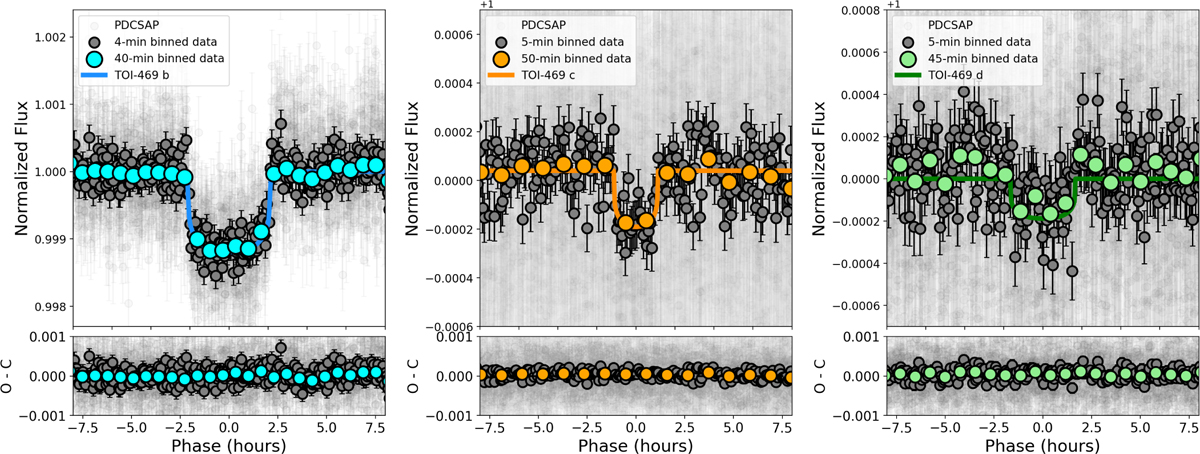
TESS PDCSAP light curve with the GP component subtracted, and phase-folded to the orbital periods of HIP 29442 b (first panel), HIP 29442 c (second panel), and HIP 29442 d (third panel). The solid lines indicate the models calculated using the median of the posteriors. Residuals of the best-fit model are shown at the bottom of each phase-folded plot.
Current usage metrics show cumulative count of Article Views (full-text article views including HTML views, PDF and ePub downloads, according to the available data) and Abstracts Views on Vision4Press platform.
Data correspond to usage on the plateform after 2015. The current usage metrics is available 48-96 hours after online publication and is updated daily on week days.
Initial download of the metrics may take a while.