Fig. 5
Download original image
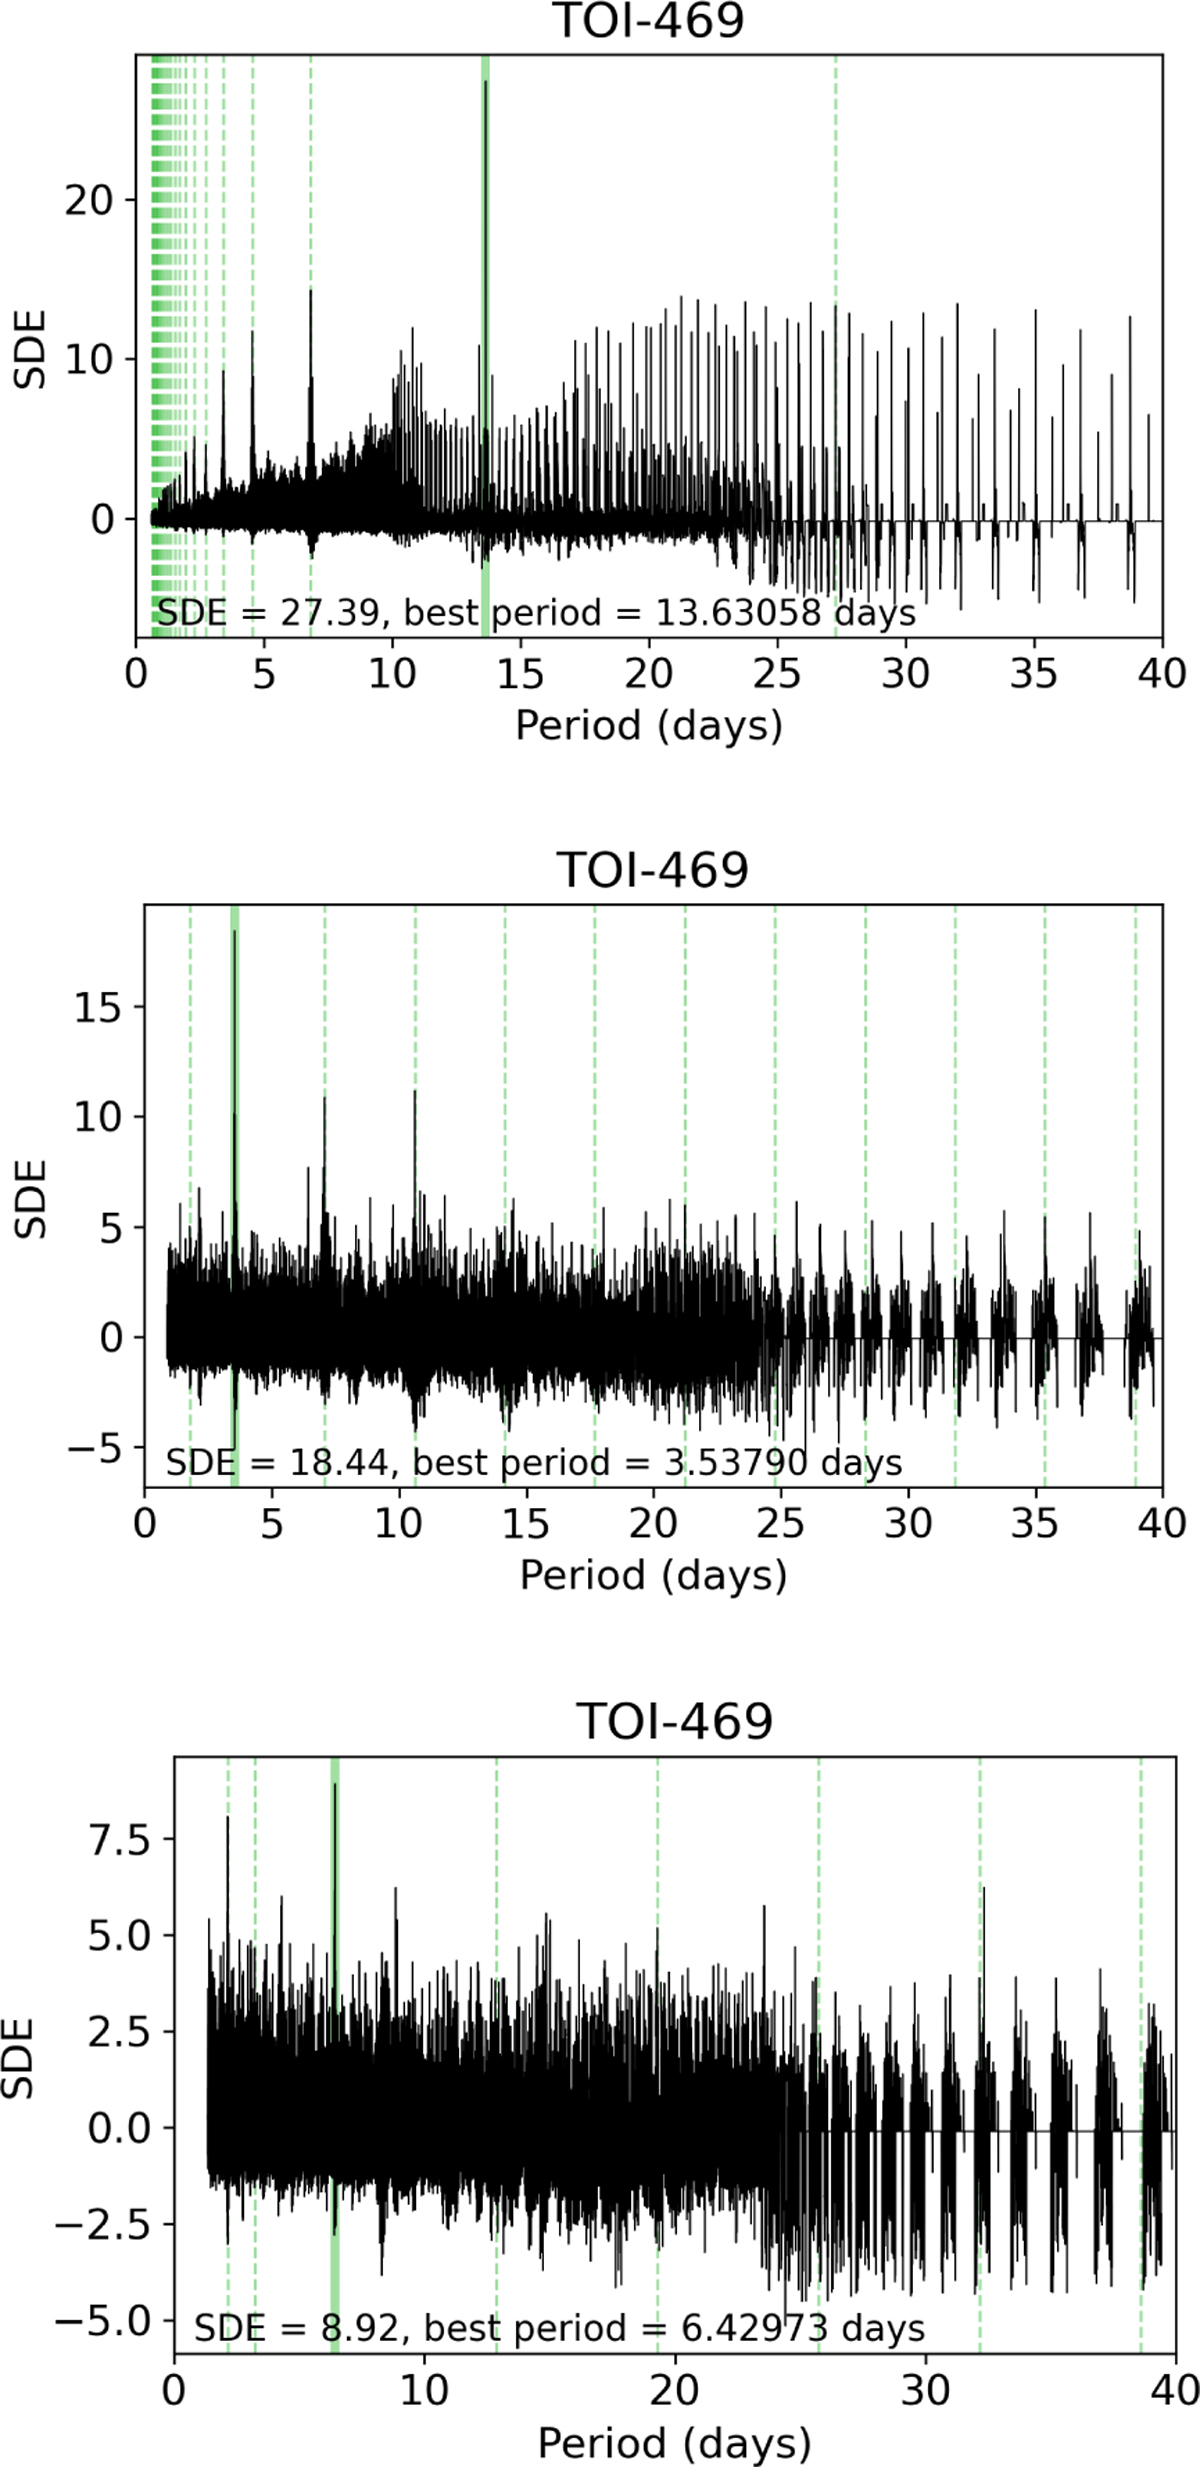
TLS periodograms of the detrended TESS light curve (see Sect. 2.1) showing peaks of the three transiting planets. The periodogram in the second panel was obtained after masking the transits of planet b, and that in the third panel was calculated after masking the transits of planets b and c. The dashed lines correspond to the harmonics of the orbital periods. Planets c and b were identified first in the ESPRESSO RV time series; their presence was confirmed by the transit signals detected in the TESS data.
Current usage metrics show cumulative count of Article Views (full-text article views including HTML views, PDF and ePub downloads, according to the available data) and Abstracts Views on Vision4Press platform.
Data correspond to usage on the plateform after 2015. The current usage metrics is available 48-96 hours after online publication and is updated daily on week days.
Initial download of the metrics may take a while.