Open Access
Fig. 3
Download original image
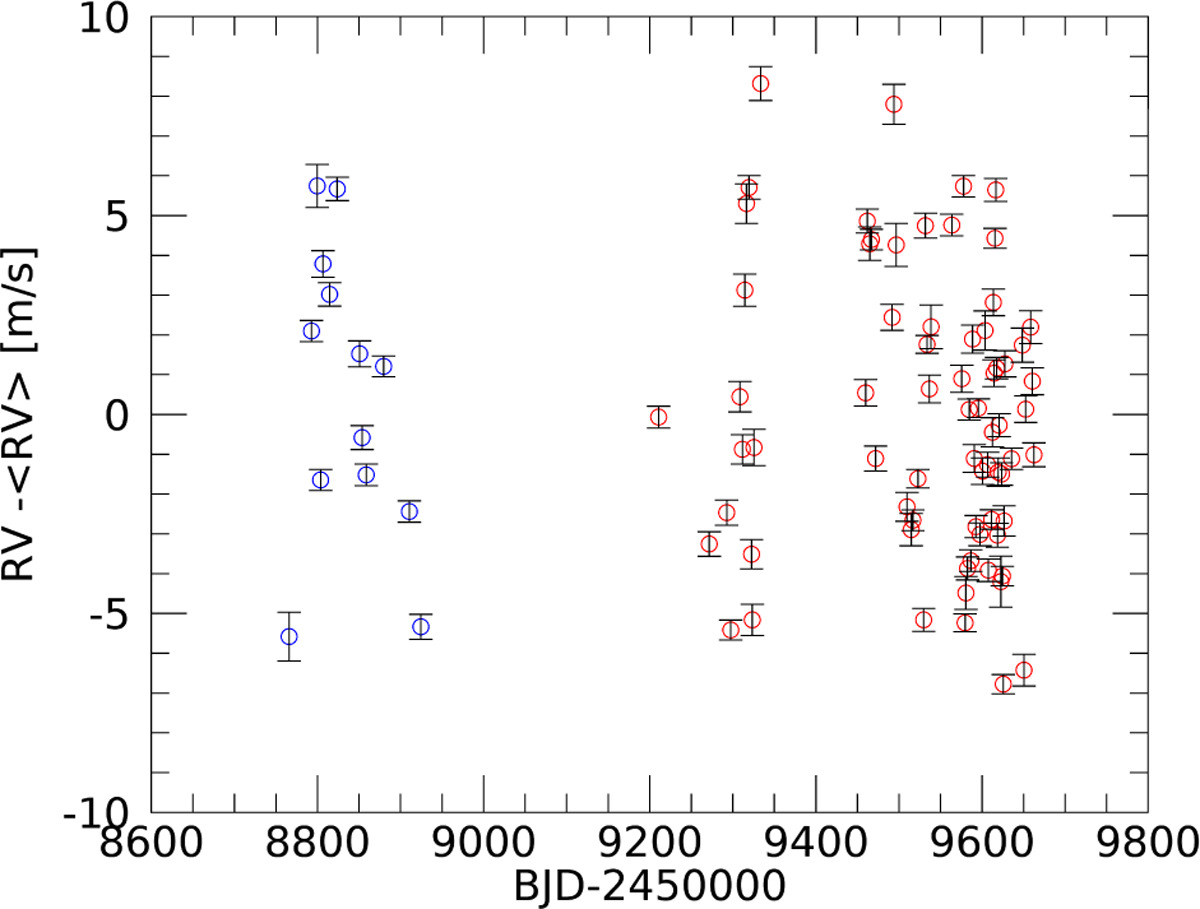
ESPRESSO RVs. Blue circles: pre-COVID dataset; red circles: post-COVID dataset. The mean value of the full dataset has been subtracted from the original data. No offset has been subtracted from the two subsamples. The error bars represent the formal RV uncertainties derived by the DRS pipeline.
Current usage metrics show cumulative count of Article Views (full-text article views including HTML views, PDF and ePub downloads, according to the available data) and Abstracts Views on Vision4Press platform.
Data correspond to usage on the plateform after 2015. The current usage metrics is available 48-96 hours after online publication and is updated daily on week days.
Initial download of the metrics may take a while.