Open Access
Fig. 2
Download original image
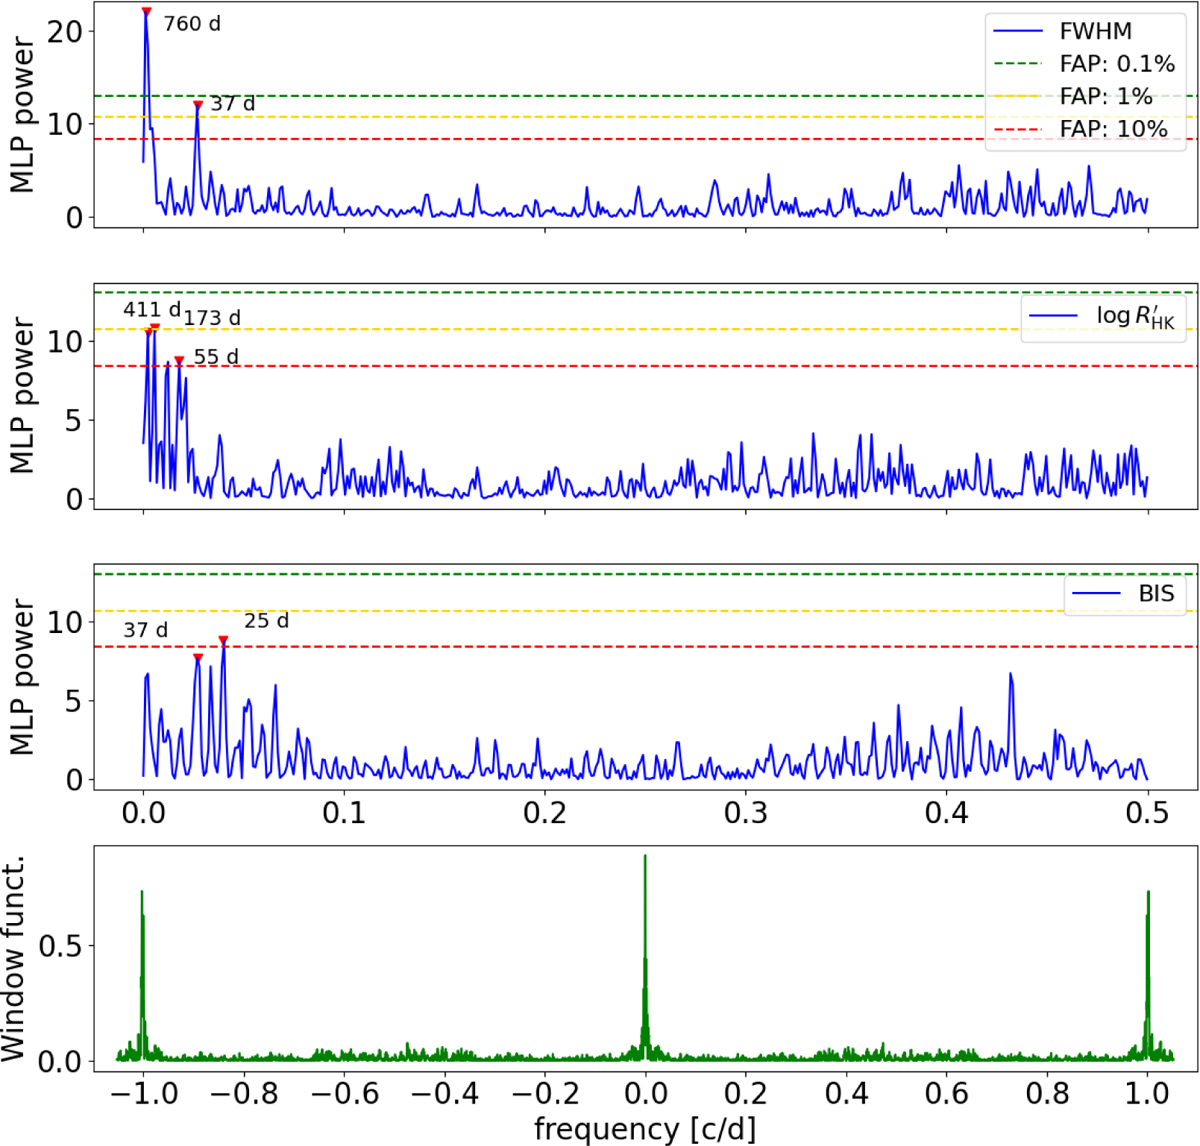
Maximum likelihood periodograms of spectroscopic activity diagnostics of HIP 29442. The window function of the data is shown in the lower panel. The periodograms include levels of analytical FAR
Current usage metrics show cumulative count of Article Views (full-text article views including HTML views, PDF and ePub downloads, according to the available data) and Abstracts Views on Vision4Press platform.
Data correspond to usage on the plateform after 2015. The current usage metrics is available 48-96 hours after online publication and is updated daily on week days.
Initial download of the metrics may take a while.