Fig. 10
Download original image
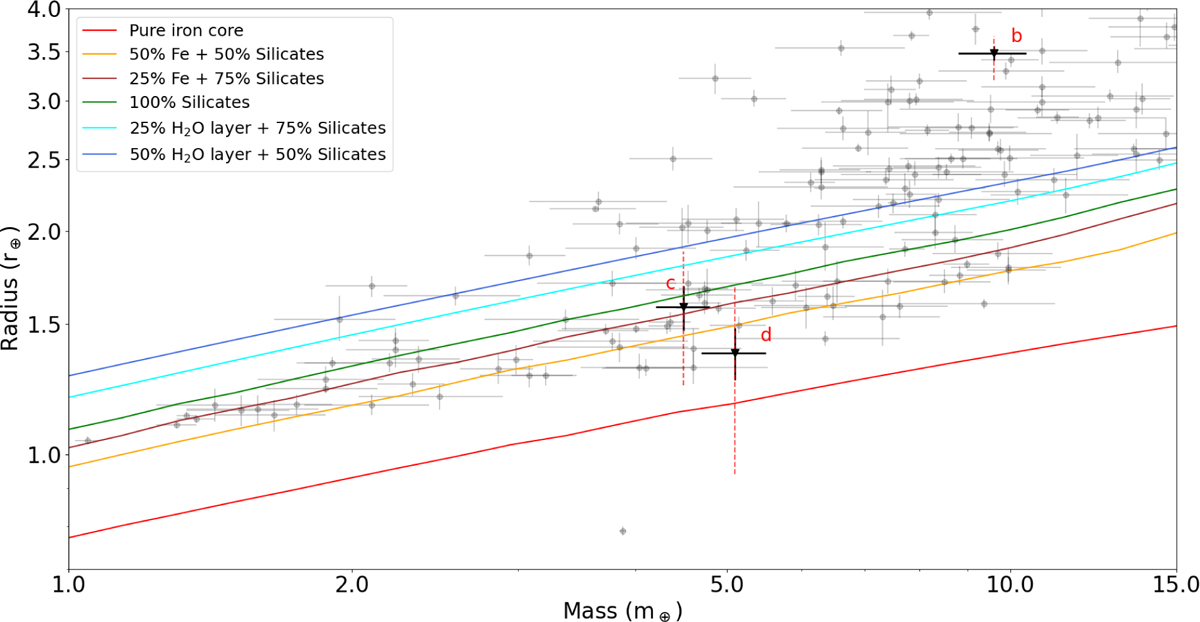
Mass-radius diagram for planets with mass <20 M⊕ and radius <4 R⊕, selected from the TEPCAT sample, available at https://www.astro.keele.ac.uk/jkt/tepcat/ (updated to 22 March 2023; Southworth 2011). The grey dots represent planets with mass and radius measured with a relative precision lower than 20% and 10%, respectively. The planets of the HIP 29442 system are indicated by black triangles. The 1σ confidence intervals for the radius measurements are shown as black lines, while the red dashed lines indicate the 3σ confidence intervals. The overplotted theoretical curves are derived by assuming equations of state detailed in Leleu et al. (2021).
Current usage metrics show cumulative count of Article Views (full-text article views including HTML views, PDF and ePub downloads, according to the available data) and Abstracts Views on Vision4Press platform.
Data correspond to usage on the plateform after 2015. The current usage metrics is available 48-96 hours after online publication and is updated daily on week days.
Initial download of the metrics may take a while.